NASA combined Earth Observatory satellite imagery with GEOS model temperatures to map the January polar vortex over North America. The blended data show cold air pushing south and east and lingering for days as high-pressure systems forced the jet stream into a deep dip. These satellite-model products improve situational awareness and help emergency managers, utilities and transport agencies prioritize recovery where prolonged cold amplifies risks.
NASA Maps January Polar Vortex: Satellite-Model Blend Reveals Lingering Arctic Chill

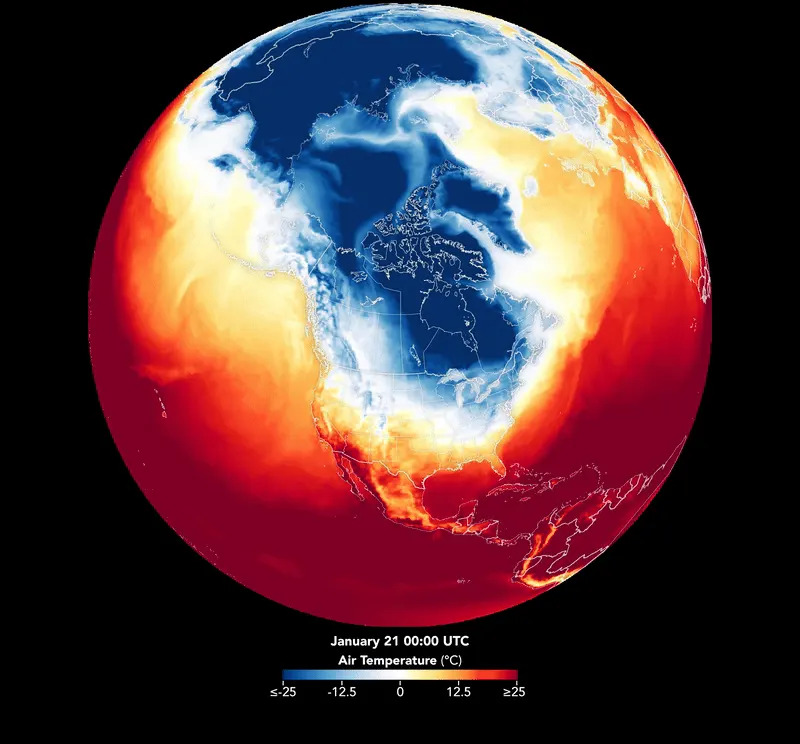
A close up of January 2026's brutally cold winter storm. | Credit: NASA Earth Observatory images and animation by Lauren Dauphin, using GEOS data from the Global Modeling and Assimilation Office at NASA GSFC
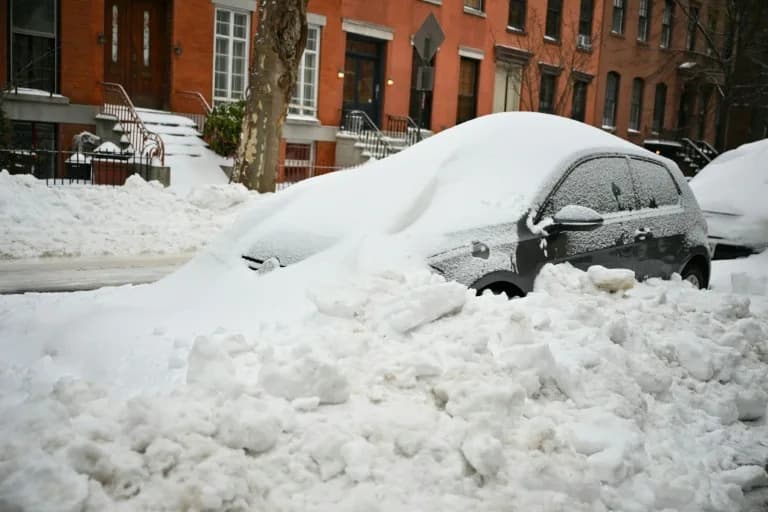
After a major winter storm swept across the United States in late January, a prolonged surge of Arctic air gripped large regions, driving temperatures far below normal from the Midwest to the South and producing extreme snow and ice impacts.
A time lapse showing the polar vortex from Jan. 21 to Jan. 27, as the cold front lingered over North America. | Credit: NASA Earth Observatory images and animation by Lauren Dauphin, using GEOS data from the Global Modeling and Assimilation Office at NASA GSFC
Even after the storm systems moved on, the cold persisted. To examine the broader footprint of that cold spell, NASA combined Earth Observatory satellite observations with temperature fields from the Goddard Earth Observing System (GEOS) global model to map the temperatures associated with the polar vortex across North America.
How the Mapping Was Done
Satellite measurements provided broad spatial coverage while GEOS delivered modeled temperature fields. Blending the two produced continuous, high-resolution maps that capture both the near-surface daily warming/cooling cycle and the larger, longer-lived pattern of cold air. NASA and partner scientists compiled these maps into a time-lapse video showing the polar-vortex cold mass pushing south and east and lingering for much of the week.
Meteorological Drivers
Meteorologists say the event resulted from frigid Arctic air funneling into eastern North America. Strong high-pressure systems helped force the jet stream into a pronounced southward dip, allowing cold polar air to spill into lower latitudes and remain in place longer than typical post-storm cooling.
Impacts And Operational Value
Prolonged exposure to extreme cold magnifies the disruption from snow and ice: it increases risks of hypothermia and frostbite, strains shelters and hospitals, prolongs power outages, and makes routine repairs more difficult and dangerous. For emergency managers, utilities and transportation agencies, improved maps of cold intensity, duration and spread help prioritize recovery resources and operational decisions.
Related Observations
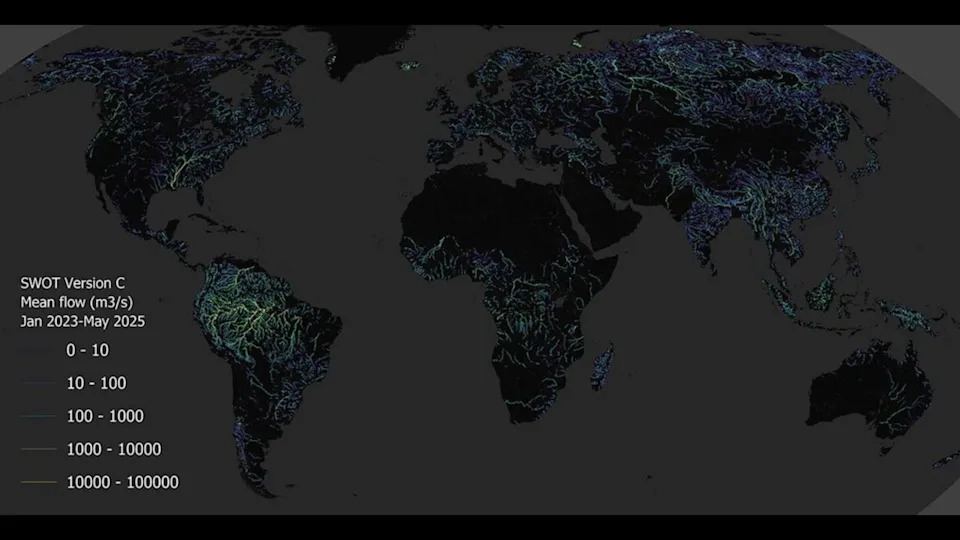
Alongside the polar-vortex maps, the release also includes NASA's first global estimate of river water discharge and suspended-sediment transport — a new dataset that helps scientists track freshwater and sediment flows into oceans.
Separately, NASA imagery captured an explosive eruption of the volcano Hayli Gubbi in late November, which sent a towering plume of ash and gases into the atmosphere. Those observations help researchers study volcanic plumes and their short-term impacts on air quality and atmospheric circulation.
When satellite observations are blended with numerical models like GEOS, the resulting products fill gaps between ground stations, improve situational awareness across large regions, and provide actionable intelligence for decision-makers responding to extreme weather and environmental events.
You can learn more about Earth-observing satellites and environmental science through NASA's Earth Observatory and partner resources.
Help us improve.