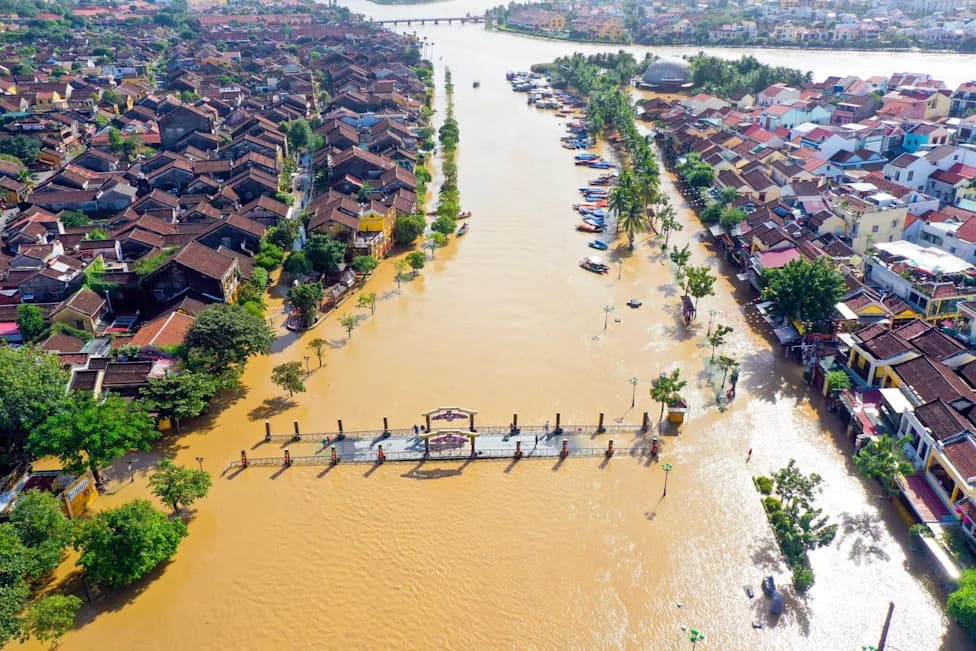
Rising seas driven by human-caused climate change are already increasing coastal flooding across many U.S. cities, with some locations now experiencing dozens of flood days per year. Climate Central data (2016–2025) and Coastal Risk Finder projections show Kahului, HI, leads the ranking with an average of 44.6 flood days per year (100% climate-driven), followed by Hilo and several Florida and California communities. Local historical sea-level rise ranges from roughly 2.7 to 6.5 inches; projected increases by 2100 under current commitments fall between about 1.5 and 2.5 feet. Without large-scale adaptation spending or deep emissions reductions, some coastal communities may become increasingly difficult to inhabit.
US Coastal Cities Most Affected by Climate-Driven Flooding — Kahului Tops the List
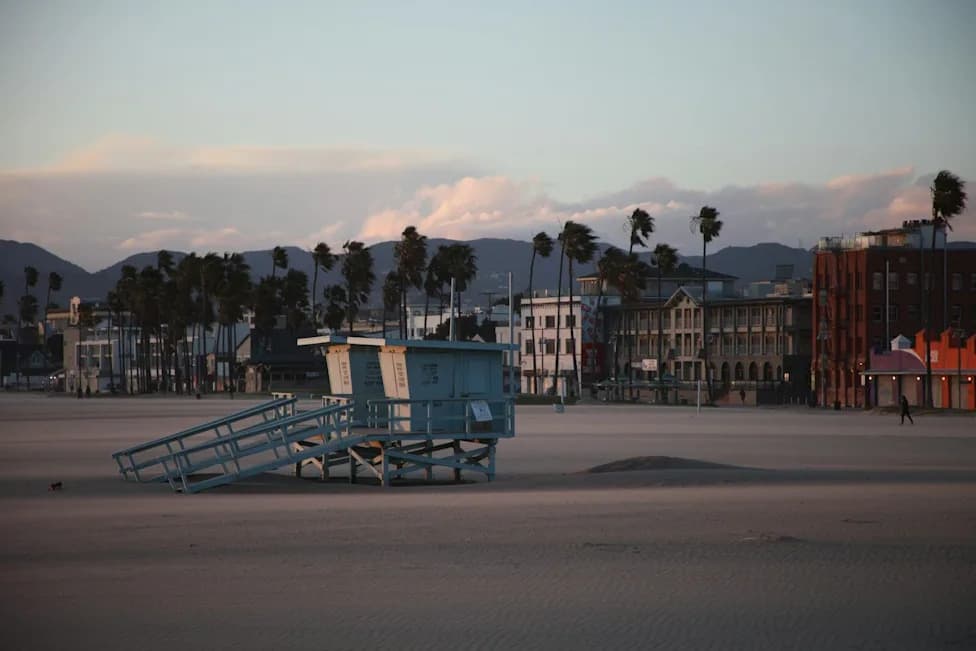
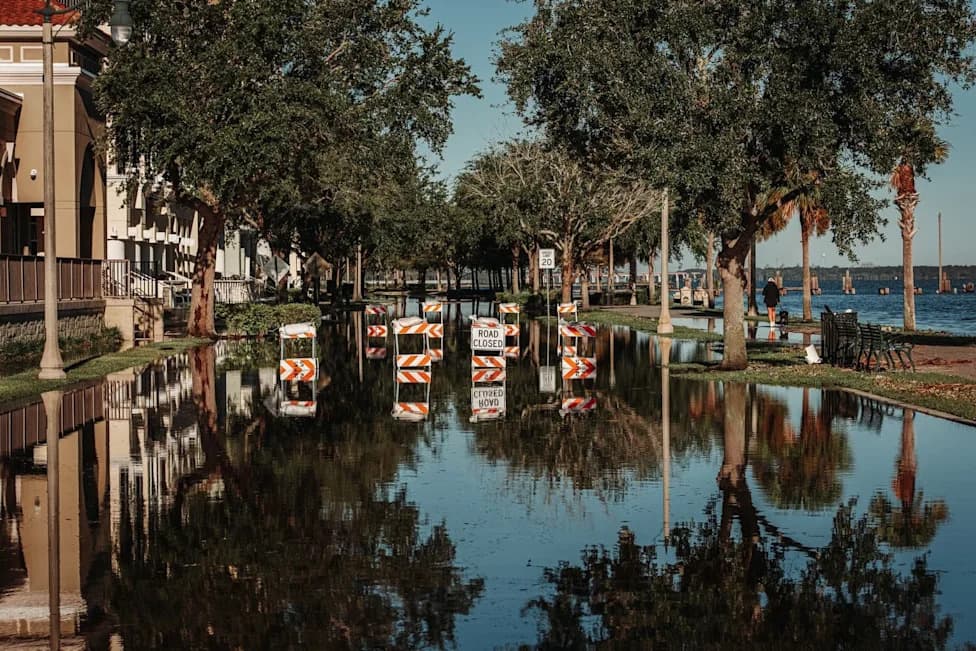
Photo by Casper Westera on Unsplash
Sea-level rise is one of the clearest and most damaging consequences of human-caused climate change. As greenhouse gases trap more heat in the atmosphere, higher global temperatures are accelerating the melt of glaciers and ice sheets and sending billions of tons of water into the world’s oceans each year. Across large stretches of the U.S. coastline, sea levels are already substantially higher than they were in the early 20th century, and by the end of the 21st century sea-level rise is expected to be measured in feet rather than inches under current emissions commitments.
Using data from Climate Central and supplemental figures from the Coastal Risk Finder, Climate Crisis 247 ranked coastal U.S. cities by their average annual coastal-flooding days between 2016 and 2025. The list includes only locations where at least 85% of flooding days are attributable to human-caused climate change. Projections assume current emissions commitments remain unchanged.
Key Findings: Local historical sea-level increases among these cities range roughly from 2.7 to 6.5 inches, while projected rises by 2100 fall between about 1.5 and 2.5 feet. Without deep emissions reductions or major spending on protective infrastructure, some coastal communities face growing risk of becoming effectively uninhabitable in coming decades.
Top 10 Cities (Average Coastal Flooding Days Per Year, 2016–2025)
10. Santa Monica, California
- Average coastal flooding days: 10.5 per year (105 total)
- Percentage attributable to climate change: 98%
- Worst recent year: 2018 — 18 flood days (all climate-driven)
- Local sea-level rise since 1975: 3.4 inches
- Projected rise by 2100: 1.5 feet
9. North Spit, California
- Average coastal flooding days: 10.6 per year (106 total)
- Percentage attributable to climate change: 86%
- Worst recent year: 2023 — 16 flood days (15 climate-driven)
- Local sea-level rise since 1979: 3.0 inches
- Projected rise by 2100: 1.8 feet
8. Port Canaveral, Florida
- Average coastal flooding days: 11.3 per year (113 total)
- Percentage attributable to climate change: 87%
- Worst recent year: 2023 — 21 flood days (all climate-driven)
- Local sea-level rise since 1995: 2.7 inches
- Projected rise by 2100: 2.3 feet
7. Los Angeles, California
- Average coastal flooding days: 15.2 per year (152 total)
- Percentage attributable to climate change: 95%
- Worst recent year: 2022 — 24 flood days (all climate-driven)
- Local sea-level rise since 1924: 5.8 inches
- Projected rise by 2100: 1.5 feet
6. San Francisco, California
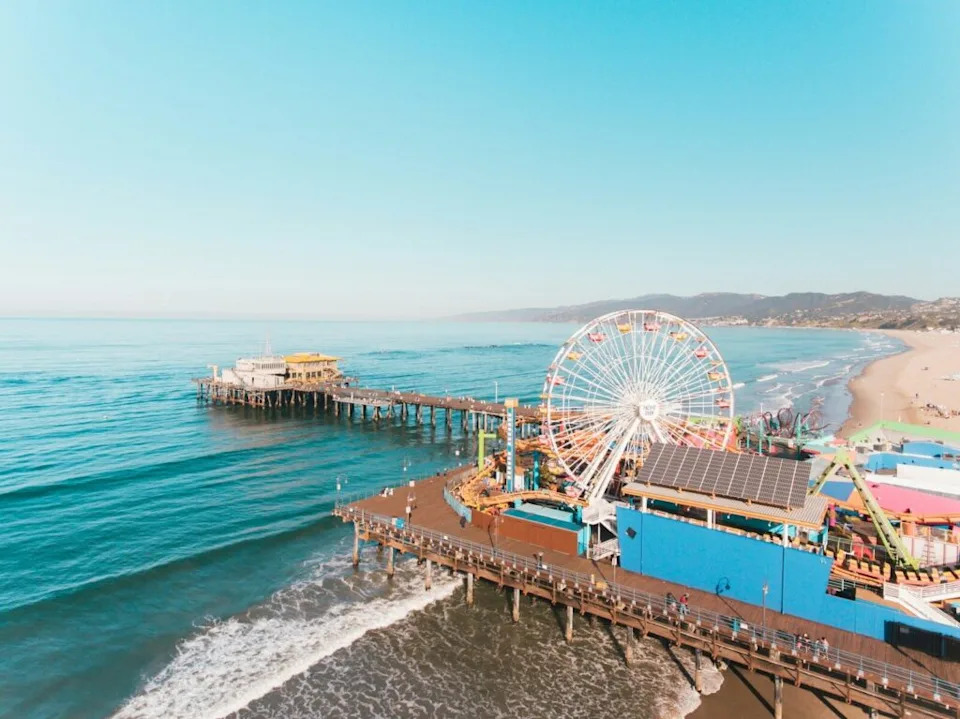
Photo byMatthew LeJuneonUnsplash
- Average coastal flooding days: 15.9 per year (159 total)
- Percentage attributable to climate change: 92%
- Worst recent year: 2023 — 35 flood days (34 climate-driven)
- Local sea-level rise since 1900: 6.1 inches
- Projected rise by 2100: 1.7 feet
5. Virginia Key, Florida
- Average coastal flooding days: 22.3 per year (223 total)
- Percentage attributable to climate change: 90%
- Worst recent year: 2019 — 47 flood days (43 climate-driven)
- Local sea-level rise since 1995: 2.8 inches
- Projected rise by 2100: 2.3 feet
4. Key West, Florida
- Average coastal flooding days: 24.3 per year (243 total)
- Percentage attributable to climate change: 97%
- Worst recent year: 2022 — 45 flood days (44 climate-driven)
- Local sea-level rise since 1914: 6.4 inches
- Projected rise by 2100: 2.3 feet
3. Vaca Key, Florida
- Average coastal flooding days: 26.6 per year (266 total)
- Percentage attributable to climate change: 96%
- Worst recent year: 2019 — 47 flood days (all climate-driven)
- Local sea-level rise since 1977: 3.5 inches
- Projected rise by 2100: 2.4 feet
2. Hilo, Hawaii
- Average coastal flooding days: 38.9 per year (389 total)
- Percentage attributable to climate change: 98%
- Worst recent year: 2020 — 76 flood days (73 climate-driven)
- Local sea-level rise since 1928: 6.5 inches
- Projected rise by 2100: 2.5 feet
1. Kahului, Hawaii
- Average coastal flooding days: 44.6 per year (446 total)
- Percentage attributable to climate change: 100%
- Worst recent year: 2020 — 84 flood days (83 climate-driven)
- Local sea-level rise since 1954: 4.9 inches
- Projected rise by 2100: 2.3 feet
These city-level figures demonstrate how sea-level rise, shifts in tides, and changing storm patterns are already increasing coastal flooding frequency across U.S. population centers. Many communities face difficult choices: invest hundreds of billions in coastal defenses, plan for managed retreat, or pursue deep, rapid emissions cuts to reduce long-term risk.
Related coverage: analyses of municipal investments in protections, the affordability challenges of adaptation, seasonal weather shifts, and projections of potential economic losses from repeated coastal flooding.
Photo credit: Matthew LeJeune / Unsplash
Help us improve.