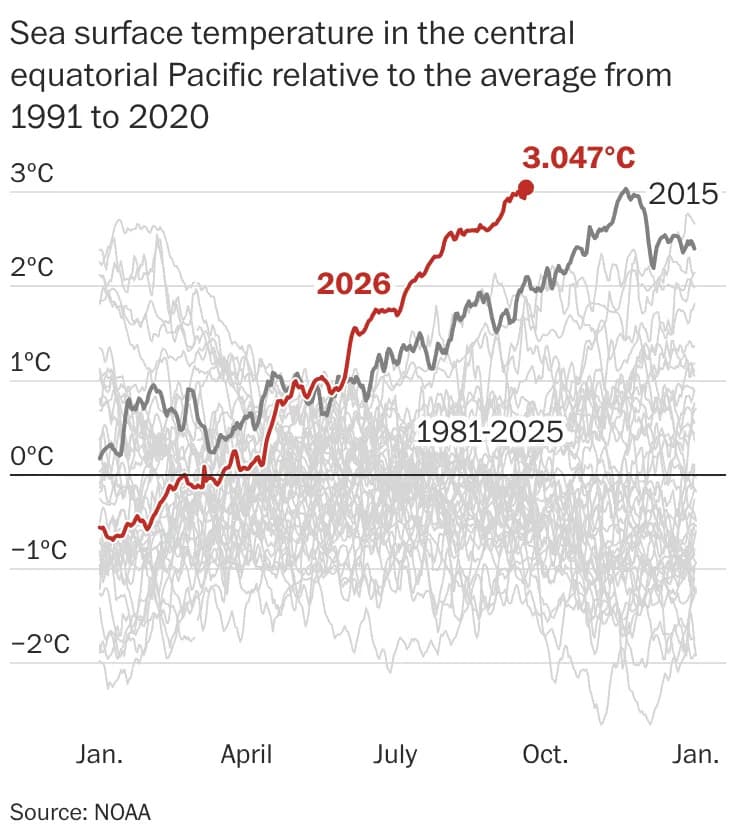
Rapid background warming of the tropical Pacific has begun to mask El Niño and La Niña signals measured by the traditional Niño 3.4-based Oceanic Niño Index. Scientists now use the Relative Oceanic Niño Index (RONI), which subtracts broader tropical Pacific anomalies from Niño 3.4 anomalies to remove the warming baseline. RONI highlights true relative ocean variability, improves the link to atmospheric impacts and allows earlier, more reliable forecasts of floods, droughts and hurricane-season effects.
How Global Warming Changed How Scientists Detect El Niño — Meet RONI, The New Index
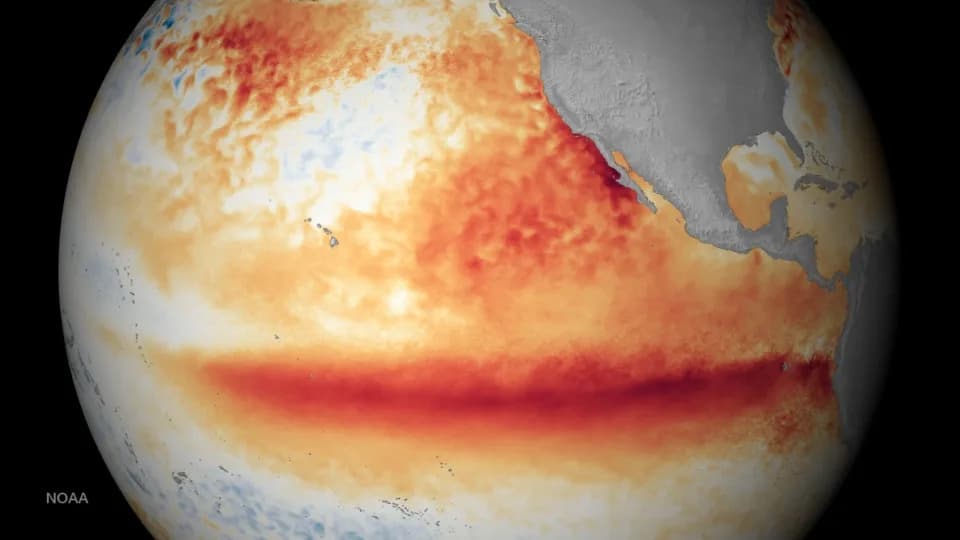
A map of ocean temperature anomalies (differences from normal) during a strong El Niño. Red colors mean the ocean water is warmer than normal; blue means it's cooler. - NOAA
Scientists have updated the way they detect El Niño and La Niña because rapid background warming across the tropical Pacific is blurring the traditional signal. A new metric, the Relative Oceanic Niño Index (RONI), subtracts the broader tropical Pacific warming from the Niño 3.4 region anomaly so El Niño/La Niña stand out more clearly. That makes events easier to spot earlier and improves long-range forecasts tied to their impacts.
Why The Old Index Began To Fail
For decades researchers used the Oceanic Niño Index (based on the Niño 3.4 region) to identify El Niño and La Niña. That method compares sea surface temperature anomalies in a central-eastern band of the tropical Pacific to the rest of the basin: the larger the contrast, the stronger the event.
But as global warming raised baseline temperatures across the entire tropical Pacific, that background warming started to mask the contrast the old index depended on. In effect, if the ocean is unusually warm everywhere, the Niño 3.4 anomaly can look weak even when it is driving major atmospheric changes.
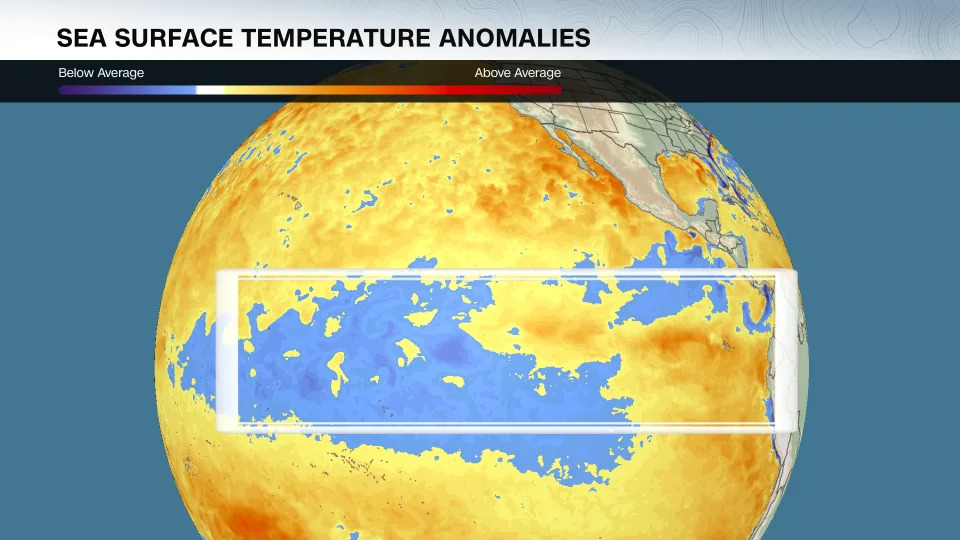
The rectangle shows the area of the Pacific that scientists look to for detecting El Niño and La Niña. Water temperatures are mostly cooler-than-average now, indicating weak La Niña conditions are present. - CNN Weather
What RONI Actually Does
RONI (Relative Oceanic Niño Index) applies a simple but powerful adjustment: it subtracts the average temperature anomaly across the wider tropical Pacific from the anomaly in the Niño 3.4 region. That subtraction removes the shifting climate baseline and highlights the true, relative signal associated with El Niño or La Niña.
Why This Matters For Forecasts And Impacts
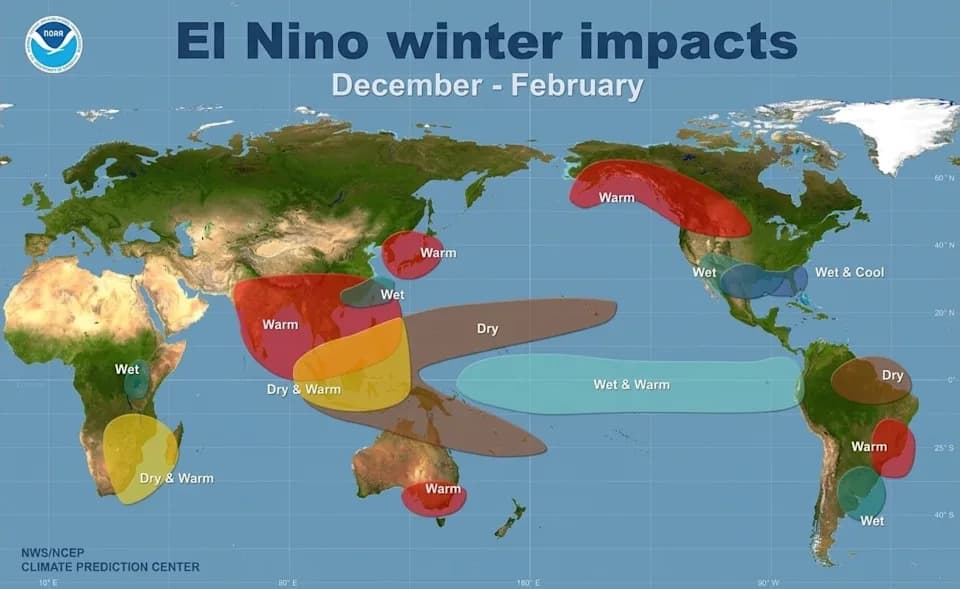
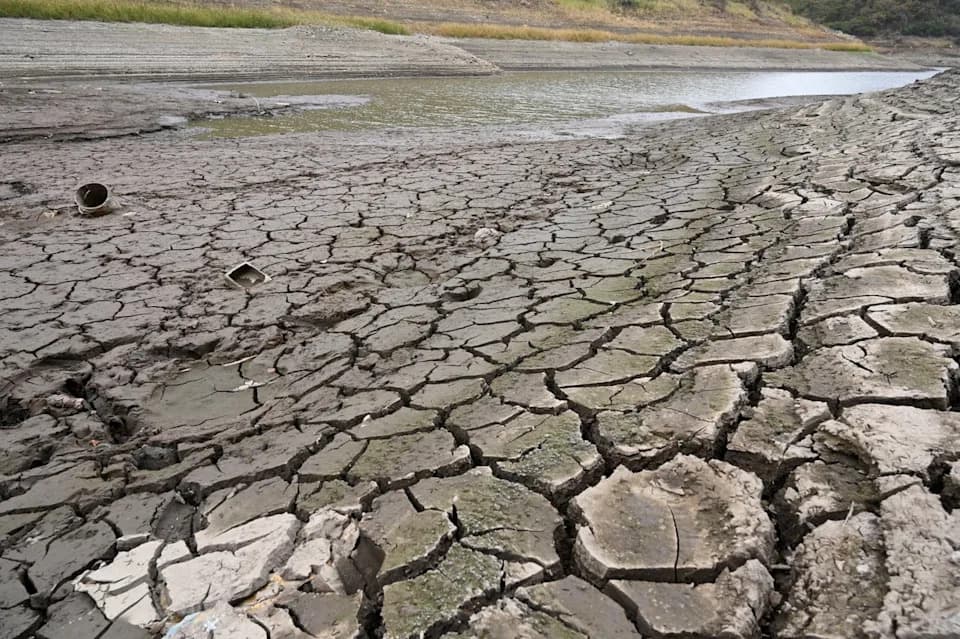
El Niño and La Niña are coupled ocean-atmosphere phenomena: to generate the familiar remote impacts (changes in rainfall, winds, or hurricane activity), ocean changes must be accompanied by corresponding atmospheric shifts. By isolating the relative ocean signal, RONI better matches those coupled atmospheric responses, helping forecasters detect events sooner and link them more reliably to downstream weather impacts such as floods, droughts and changes to the Atlantic hurricane season.
"The new index better captures the interactions between the ocean and atmosphere across the tropical Pacific Ocean," said Michelle L'Heureux of NOAA, who leads El Niño and La Niña forecasting. "The older index was increasingly capturing ocean changes that were not reflected in the overlying atmospheric circulation."
Emily Becker, a researcher at the University of Miami, added: "Over the last decade the Niño 3.4 index was getting out of sync with the impacts we saw because the global oceans warmed quickly. RONI subtracts that shifting baseline and better reflects event intensity and impacts."
In short, RONI doesn’t change what El Niño is — it changes how clearly we can see it in a warming world. The approach helps meteorologists and climate scientists separate long-term warming trends from the shorter-term ocean variations that drive extreme weather patterns, offering earlier and more reliable signals for preparation and planning.
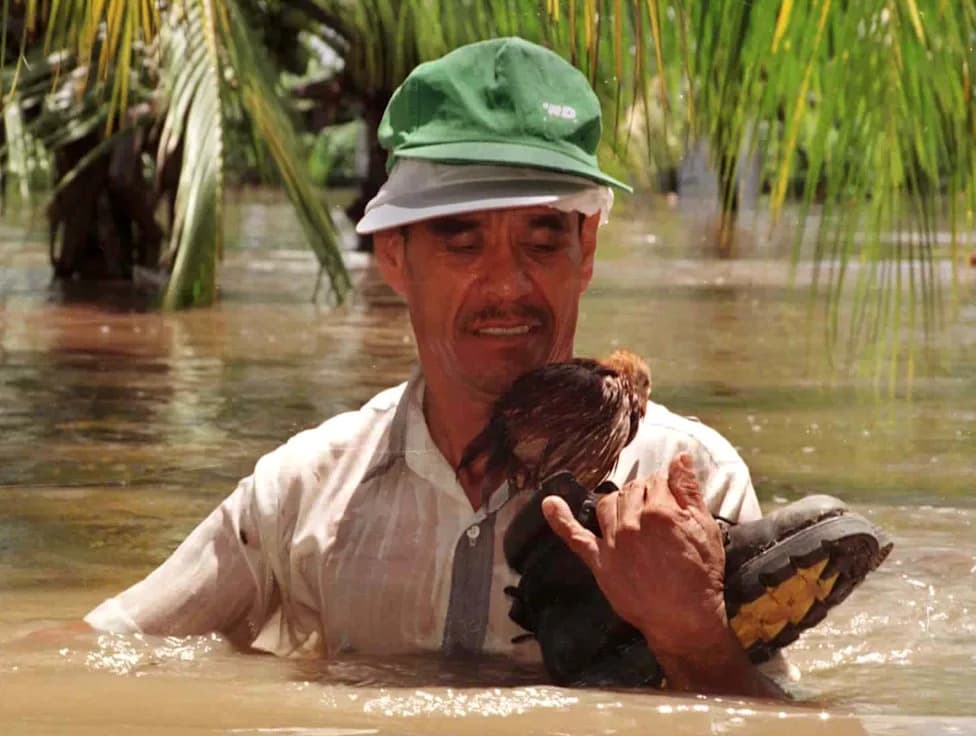
Example: The famous 1997–1998 El Niño, which inspired cultural references and sketches in the 1990s, can now be identified with greater precision relative to today’s warmer baseline, improving our ability to anticipate similar high-impact events in the future.
Help us improve.