Yellowstone's volcanic system produced a super‑eruption about 631,000 years ago. In a worst‑case modern scenario, early warning would begin weeks to months before eruption with migrating earthquake swarms, accelerating uplift and rising gas emissions, prompting phased alerts and evacuations. A VEI‑8 event could generate 30–50 km high eruption columns, pyroclastic flows and widespread heavy ashfall that would disrupt aviation, power, water, agriculture and infrastructure across much of North America. Stratospheric sulphate aerosols would likely cause several years of global cooling and contribute to long‑term health, economic and food‑security challenges, with recovery taking decades in the most affected regions.
What If Yellowstone Erupted Today? A Step‑By‑Step Worst‑Case Scenario
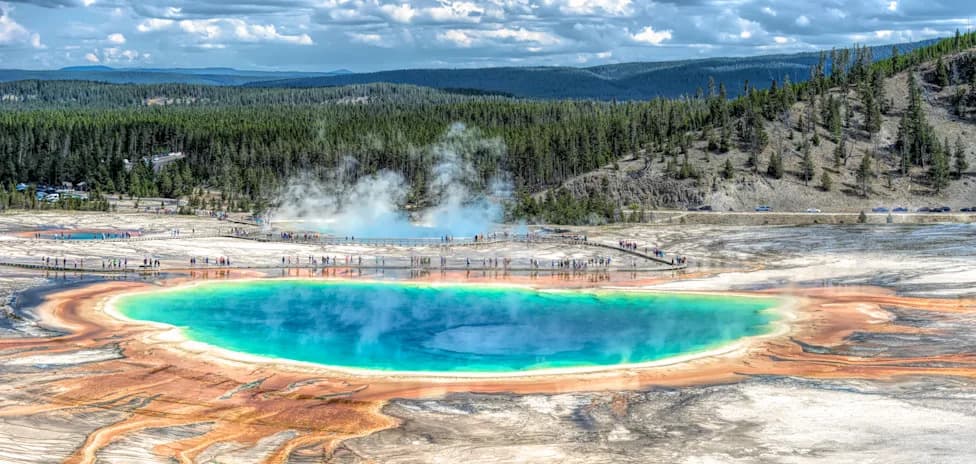
About 631,000 years ago a series of enormous eruptions at the volcanic system now beneath Yellowstone National Park reshaped landscapes, spread ash across North America and affected global climate. This article presents a scientifically grounded, readable worst‑case scenario for a modern Yellowstone super‑eruption—what would be likely to happen, how authorities might respond, and how societies could be affected in the months, years and decades that follow.
T‑2 Months — Early Signals
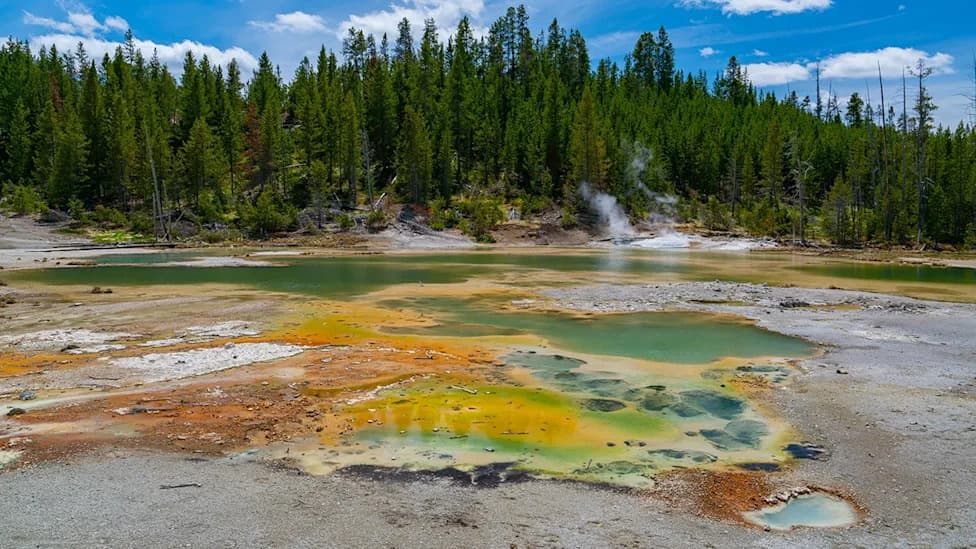
Shortly after dawn, seismologists at the University of Utah Seismograph Station notice an unusual cluster of small earthquakes beneath the Yellowstone caldera (roughly 55–70 km across). Yellowstone is continuously monitored by dense networks of seismometers, GPS stations, strainmeters, gas samplers and satellites. Scientists look for patterns: swarms that migrate upward, progressive shallowing of quakes, accelerating ground uplift and changing gas emissions.
On their own, quake swarms do not guarantee an eruption. But when multiple indicators appear together, concern rises. The team cross‑checks data, deploys temporary instruments and initiates the Yellowstone Volcano Observatory (YVO) response protocols while continuing careful observation.
T‑1 Month — Signs Intensify
Over several weeks the swarm migrates upward and concentrates beneath a narrow zone. GPS stations move apart, strain increases and satellite radar shows accelerating uplift. Gas and water chemistry change. These signals are consistent with magma intruding into the crust—similar to precursors observed before other eruptions. The Volcano Alert Level is raised from Normal to Advisory, and YVO coordinates more closely with the National Park Service and emergency managers.
Authorities run impact models, update evacuation plans and prepare public communications. Because previous episodes at Yellowstone (for example 2013–2014) produced alarming deformation without an eruption, scientists remain cautious but alert.
T‑2 Weeks — Unrest Accelerates
Earthquakes become more frequent and shallower. Long‑period seismic events and sustained tremor — often associated with fluid movement — appear. Uplift accelerates and hydrothermal features become erratic. Gases such as CO₂ and sulphur compounds increase in hot springs. Taken together these signals strongly suggest magma and pressurised fluids are exploiting fractures toward the surface.
T‑1–0 Weeks — Public Alerts and Evacuations
If models indicate a high probability of a large eruption, YVO and government agencies would raise warnings and expand evacuations. In this scenario officials announce an evacuation zone extending roughly 100 km beyond the park, affecting on the order of 200,000 residents plus visitors. Airlines re‑route flights; the USGS raises the Aviation Color Code; emergency services and federal plans (including FEMA coordination) mobilise.
International diplomacy and humanitarian planning become urgent: cross‑border reception of evacuees, logistics for food, water and shelter, and decisions about who can be relocated safely. Realities of capacity, politics and public reaction would shape outcomes and leave some people vulnerable, especially the poorest and those who refuse to leave.
T=0 — Eruption Begins
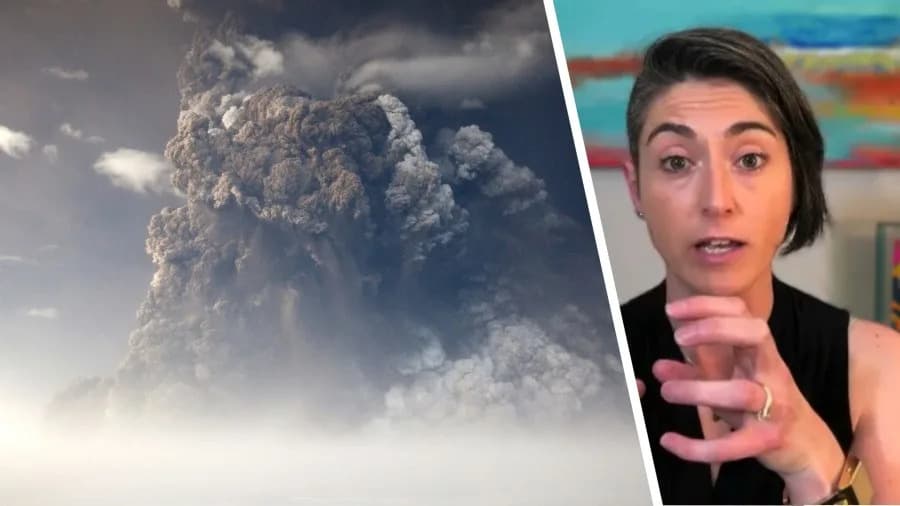
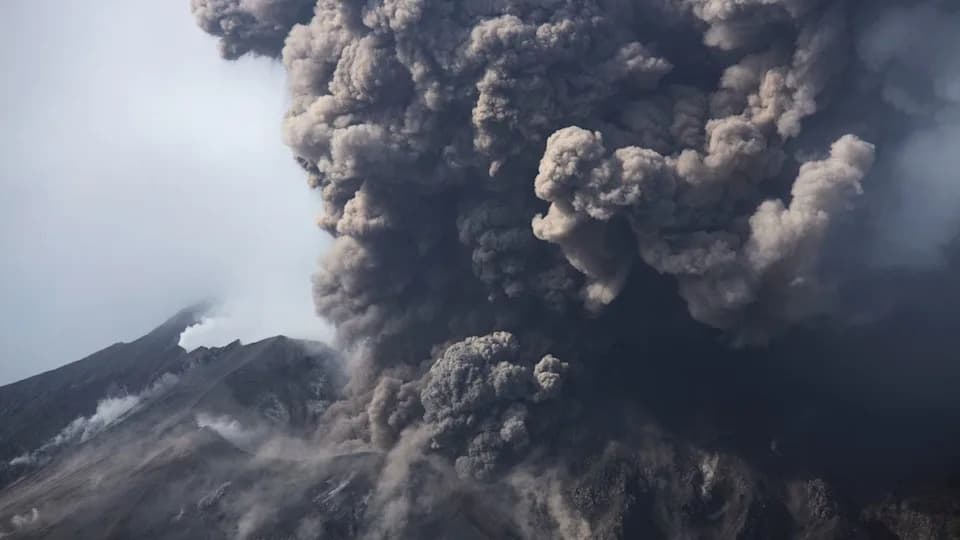
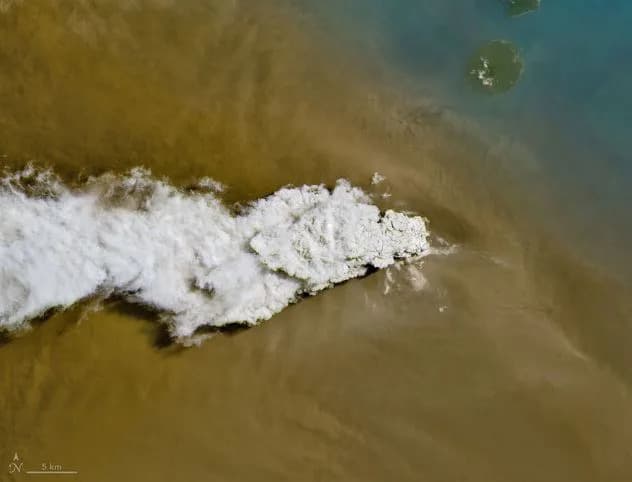
The eruption typically does not start as a single instant blast of the entire caldera. In the opening stages, magma intrudes into Yellowstone’s hydrothermal system, rapidly vaporising large volumes of groundwater and triggering violent phreatomagmatic explosions that send steam, mud and rock high into the air. Hours later, gas‑rich magma reaches the surface, fragments into pumice and ash, and forms an eruption column that may reach 30–50 km altitude.
Such an event could be classified a VEI‑8 (a super‑eruption) in a worst‑case scenario. Umbrella clouds and high‑altitude winds would distribute fine ash across thousands of kilometres within days. Parts of the column could collapse, producing pyroclastic density currents (scorching, fast currents of gas and rock) that travel tens of kilometres and devastate areas close to the source.
Immediate Local Effects
Within a few kilometres of vents, vegetation, infrastructure, wildlife and livestock are destroyed by blast, heat and ash. Pyroclastic flows and surges obliterate much in their paths. In populated regions inside those zones, fatalities would be high and many remains unrecoverable. Outside immediate flow zones, deaths would rise from vehicle accidents, respiratory emergencies, fires and loss of critical services.
T+Days—Weeks — Regional Disruption
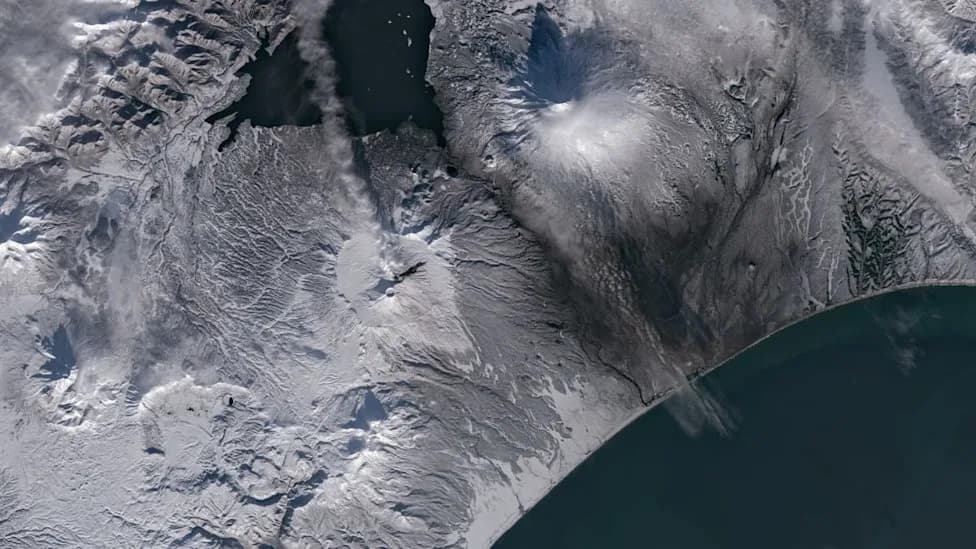
Heavy ashfall would darken skies, collapse weak roofs, clog machinery and short‑circuit electrical infrastructure. Airports would close as ash damages jet engines. Power plants, water treatment and telecom networks would suffer failures. Agriculture across multiple states could be ruined where ashburial and contamination occur; some published models show cities such as Billings potentially receiving up to ~1–1.8 m of ash in worst scenarios (model dependent).
Widespread outages of electricity, water and fuel would impair hospitals and emergency services, worsening indirect mortality. Food and supply chains would be severely strained, causing shortages and social stress.
T+Months — Climate And Economy
As ash falls out of the atmosphere, sulphur dioxide injected into the stratosphere forms sulphate aerosols that reflect sunlight. Climate models indicate a likely global cooling episode; global average cooling of up to about 1.5°C is plausible in some model runs for a few years, with stronger regional and seasonal impacts (especially across central and northern North America).
Economic impacts would include losses in agriculture, transport disruption, insurance and banking stress, and a likely global recession as trade and production falter. Repeated ash remobilisation on dry, windy days would prolong transport and aviation disruption.
T+Years — Recovery And Health Impacts
Recovery would be long and uneven. Within a decade societies would adapt agricultural practices (greenhouses, root crops, local food systems), but global food prices would remain volatile. Water access would vary regionally; some areas would experience shortages and elevated risk of water‑borne disease.
Long‑term public health consequences include increased respiratory illness from silica‑rich ash (silicosis, chronic lung disease), higher cardiovascular risks from particulate exposure, and persistent mental health and social effects. Some analyses project broad excess mortality in the hundreds of millions to low billions over extended timescales in the worst outcomes, but such numbers depend heavily on model assumptions and the scale of societal collapse. Importantly, the precise death toll and global impacts are uncertain and model‑dependent.
Decades To Millennia — Landscape And Geological Legacy
Locally the landscape would take decades to recover: lahars, erosion and barren deposits initially dominate then gradually give way to grasses and eventually forests. Geologically the caldera and deposits persist for millions of years and leave a clear imprint detectable by future observers.
This scenario synthesises published research, historical eruption analogues and emergency planning experience to outline a scientifically informed worst‑case sequence. It emphasises likely mechanisms and societal vulnerabilities rather than precise predictions. Republished with acknowledgment of the original reporting and scientific inputs.
Source: Adapted from reporting in The Conversation and scientific literature; image credit randymir / Adobe Stock.
Help us improve.