Researchers at the Complexity Science Hub, University of Waterloo and Princeton used machine learning on 20+ years of ACLED and contextual data to identify three robust conflict archetypes — Major Unrest, Local Conflict and Sporadic/Spillover — that emerged from spatio-temporal patterns in the data. The archetypes remained stable across time windows and spatial methods, but surprisingly, adding these labels to standard models often reduced the ability to predict conflict severity or duration. The study recommends using finer-grained, context-specific data for humanitarian planning and cautions against relying on static labels as predictors.
Machine Learning Finds Three Data-Driven Conflict Archetypes — And Shows Labels Don’t Predict Violence

A new study uses machine learning to reveal hidden conflict patterns and exposes limits of predicting violence severity. (CREDIT: Shutterstock)
Conventional conflict labels such as “Civil War,” “Invasion,” or “Local Uprising” carry assumptions about causes and outcomes. A new study led by researchers at the Complexity Science Hub (Vienna), with collaborators at the University of Waterloo and Princeton University, uses machine learning to let conflict patterns emerge from data rather than from expert-defined categories.
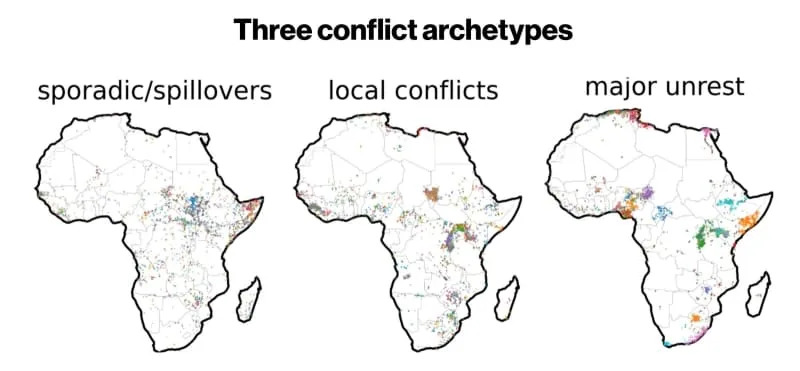
Three conflict archetypes across Africa. The panels depict sporadic/spillovers, local conflicts, and major unrest, identified using empirical conflict data and a non-heuristic, algorithmic approach. Colors indicate distinct conflict avalanches. Conflict avalanches are non-heuristic, data-derived chains of conflict events linked in space and time. (CREDIT: Complexity Science Hub)
Method
The team analysed more than 20 years of event-level data from the Armed Conflict Location and Event Data Project (ACLED), merged with contextual variables describing climate, geography, infrastructure, economics and population. Rather than training models to find preselected classes, the researchers used algorithmic clustering of spatio-temporal incident patterns and tested results across different time windows and spatial-aggregation methods to ensure robustness.
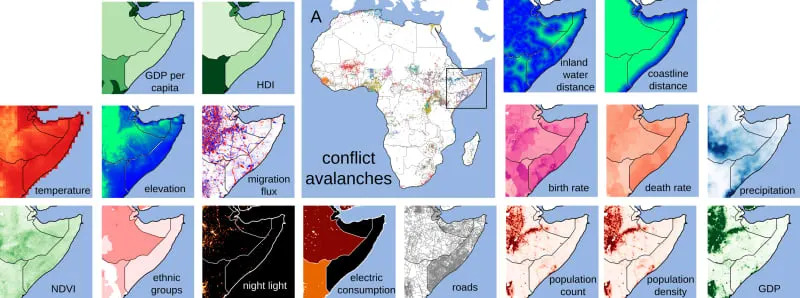
Micro-level datasets. Disaggregated conflict data from ACLED. Each point is an individual conflict event. These are grouped into conflict avalanches denoted by color. (CREDIT: Royal Society Open Science)
Three Archetypes Identified
The algorithm consistently produced three distinct archetypes of conflict:
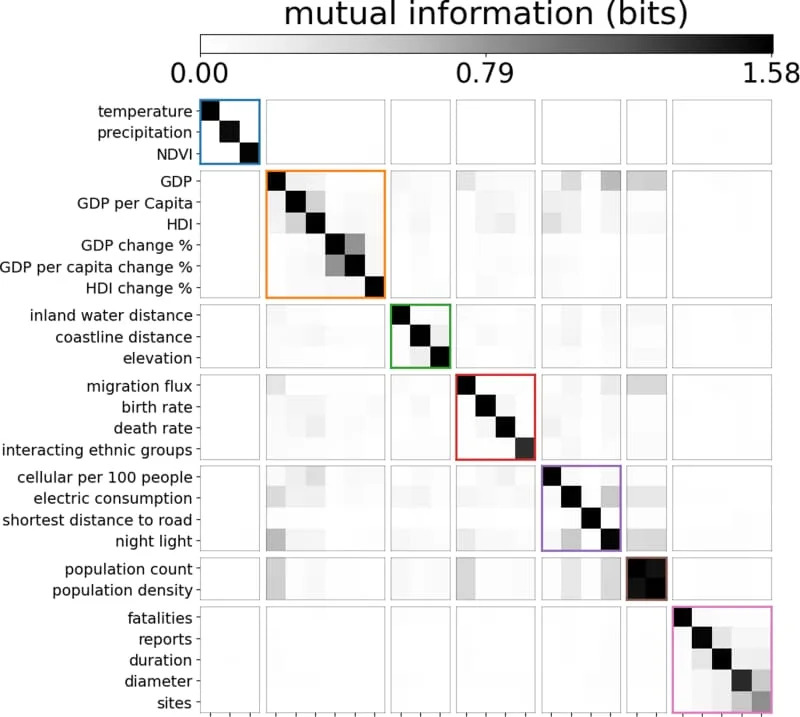
Mutual information matrix for pairs of background indicators used as conflict variables. Diagonal entries indicate the entropies as estimated with the Nemenman–Shafee–Bialek (NSB) estimator. (CREDIT: Royal Society Open Science)
Major Unrest
Long-running campaigns of violence that often concentrate in large, densely populated urban areas with strong communication and transport links. These episodes can spread across borders and persist for years. Examples include Boko Haram’s insurgency and the protracted civil war in the Central African Republic (CAR).
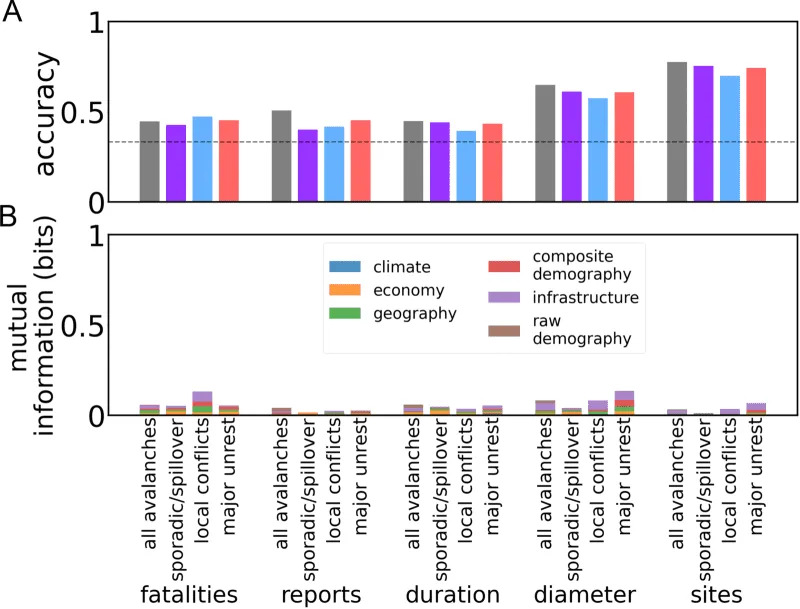
Conflict size prediction. Averaged accuracy of random forest classifiers in predicting conflict avalanche size in terms of fatalities, number of reports, duration, diameter and number of sites as below, at or above median values. (CREDIT: Royal Society Open Science)
Local Conflict
Violence that remains largely within a single country and is geographically constrained to particular regions. These conflicts typically unfold over months rather than years. The Seleka vs. anti-Balaka clashes in CAR are illustrative.
Sporadic / Spillover Conflict
Shorter, episodic bursts of violence in remote or poorly connected areas, often as spillovers from nearby wars. The spread of Al-Shabaab activity into neighboring parts of Somalia and border regions is an example.
Surprising Predictive Finding
The team then tested whether knowing a conflict’s archetype improves predictions of severity (for example, death toll) or duration. Contrary to expectations, adding the algorithmic labels to standard predictive models often degraded predictive performance. The data showed little correlation between archetype and eventual death toll or length of conflict, indicating that classification and severity prediction are distinct challenges.
Niraj Kushwaha, lead author: “The existence of three separate types of conflict is a direct outcome of the data. But knowing the type of conflict actually makes it harder to accurately predict the severity.”
Policy And Research Implications
Although the archetypes do not reliably predict how severe a conflict will become, they reveal important differences in dynamics — for example, urban, well-connected settings versus remote border areas — that matter for humanitarian planning and prevention strategies. The study encourages policymakers and aid organisations to:
- Rely less on static labels as proxies for severity;
- Use finer-grained, context-specific data in early-warning and response systems;
- Design location- and connectivity-sensitive interventions rather than one-size-fits-all approaches.
For researchers, the results highlight both the promise of algorithmic, data-driven classification and the need to expand and refine global datasets. The full study is published in Royal Society Open Science.
Help us improve.