European wildfires have burned roughly 628,000 acres and displaced an estimated 400,000 people, though reporting lags likely understate the true toll. In the United States, annual burns averaged about five million acres from 2000–2025, and 2026 is on track to be one of the worst years so far with 42,651 fires and 4,510,189 acres burned year-to-date. Major events such as the January 2025 Los Angeles fires — 57,000 acres, ~16,000 structures lost and ~440 estimated deaths — underscore the human cost. Drought (measured by the DSCI) contributes to year-to-year variability, but single mega-fires can dramatically skew national totals.
The Worst US Wildfire Years of the 21st Century — Is 2026 Joining Them?
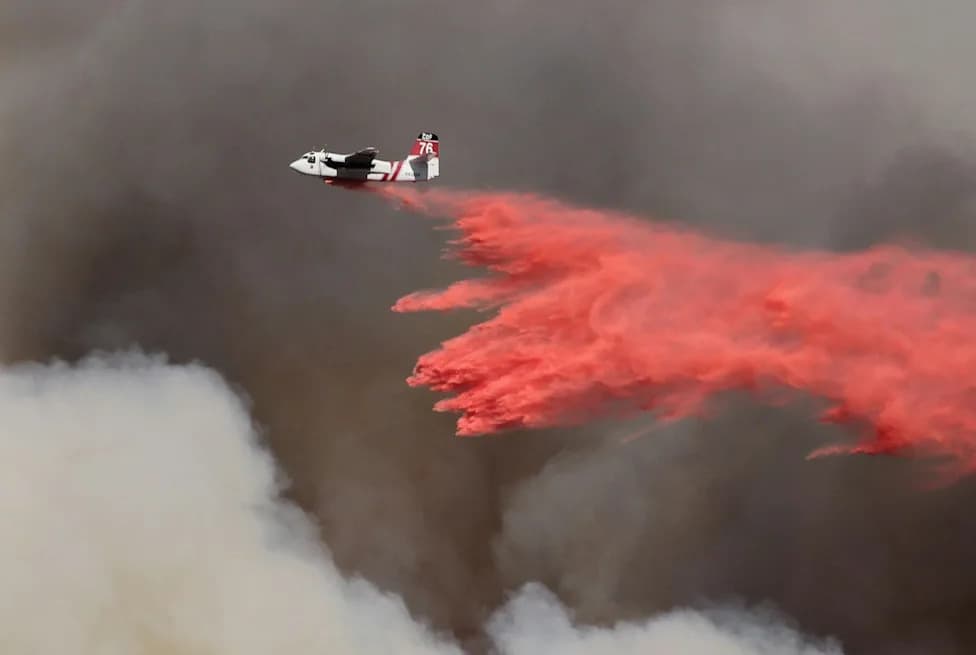
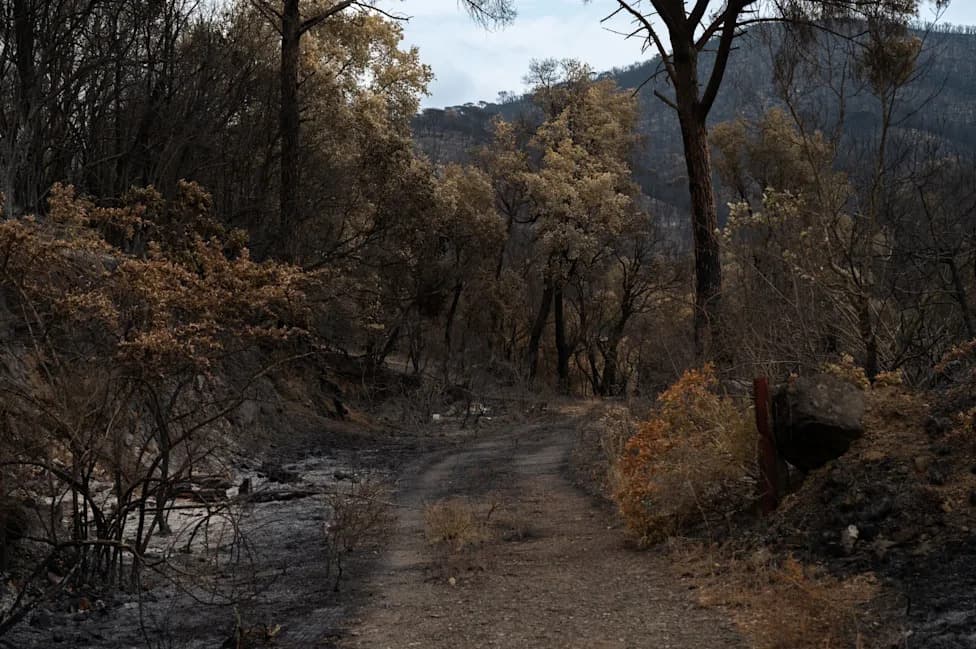
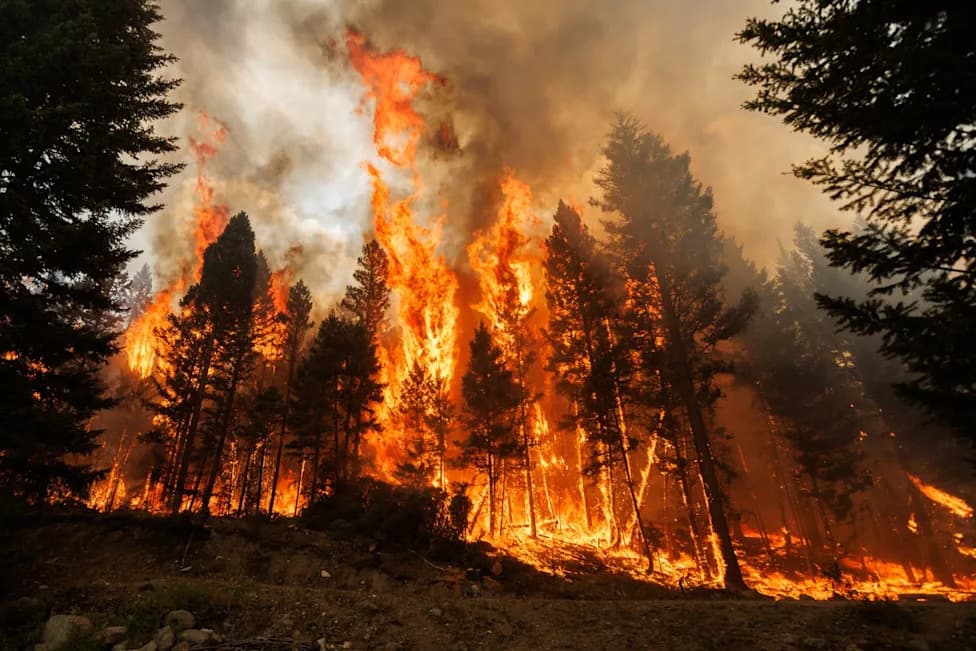
Photo by Ben Kuo on Unsplash
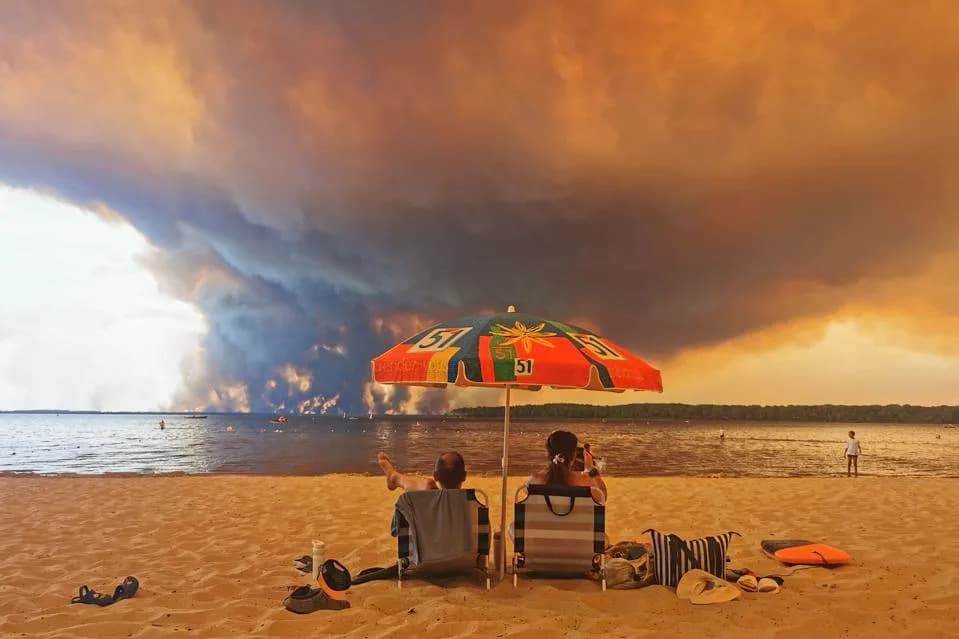
As wildfires rage across Europe, Mappr reports the JRC/EFFIS tracker shows about 628,000 acres burned so far; that official tally has not been updated in two days, so the true total is likely higher. Roughly 400,000 people have been displaced, but because each country reports evacuations differently there is no single definitive count. With extreme heat and strong winds continuing, burned acreage in Europe could plausibly exceed one million acres.
Even if this season's European blazes set regional records, Europe’s totals remain well below the average yearly area lost to wildfires in the United States. Using data from 2000 through 2025, US wildfires have averaged roughly five million acres burned per year.
For much of the 21st century, large US wildfires have rarely threatened major metropolitan populations the way current European fires are threatening cities such as Madrid (metro population ~6 million).
The most recent example of a large wildfire threatening a major US city occurred in January 2025, when fires in and around Los Angeles destroyed about 16,000 structures and consumed roughly 57,000 acres. Research from the Columbia Climate School estimates approximately 440 deaths tied to the event — 31 from direct contact with the fires and the remainder from smoke-exacerbated cardiovascular and respiratory conditions, stress-related impacts, and disruptions to health and mental-health services. More than 200,000 residents were evacuated.
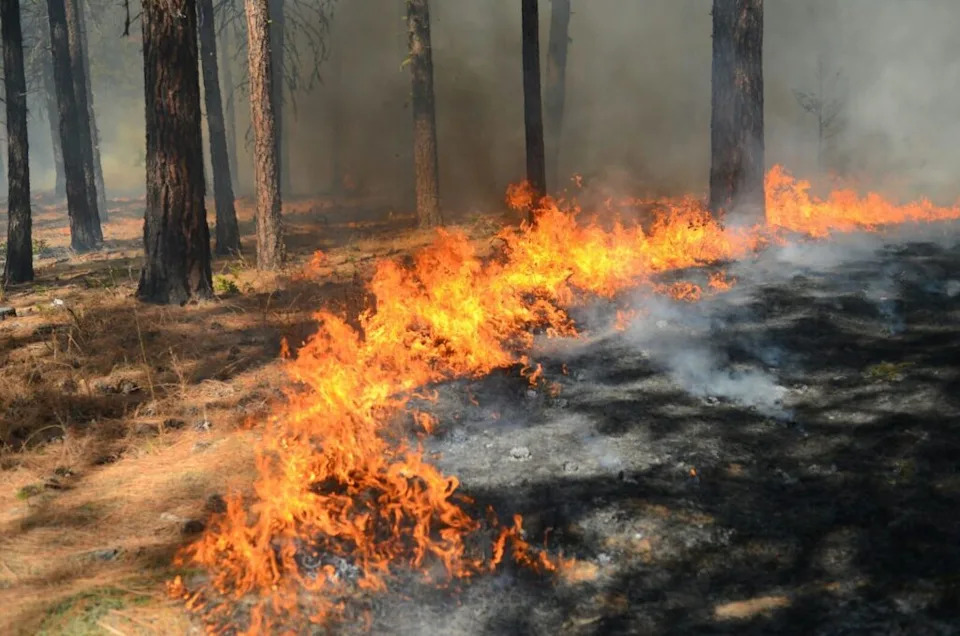
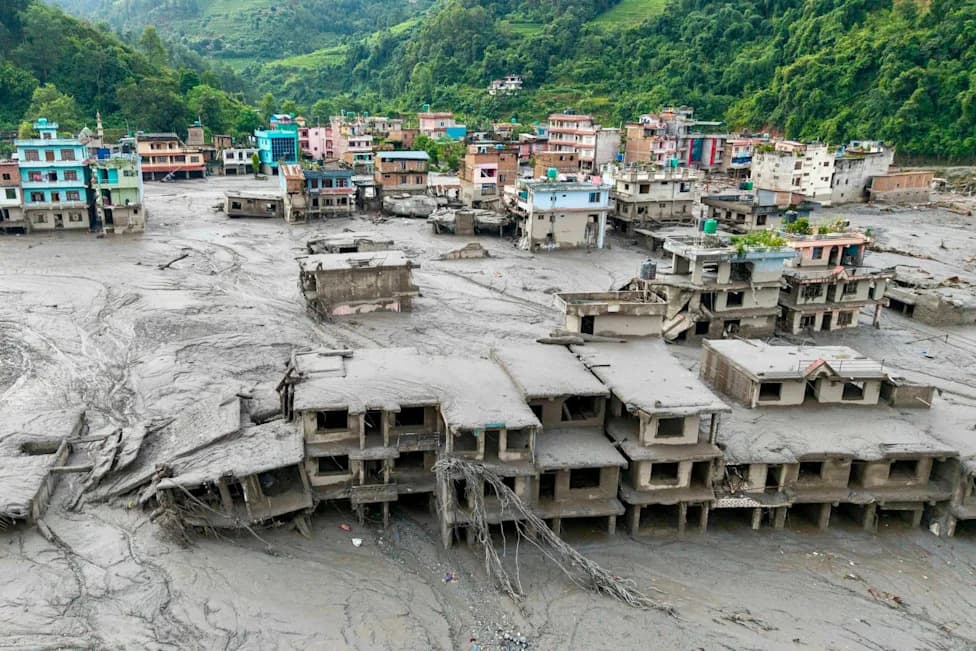
Photo byEmma RenlyonUnsplash
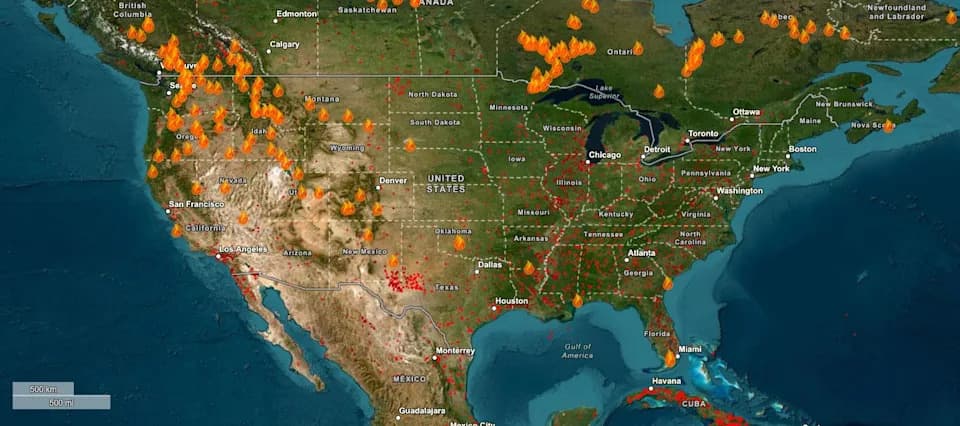
The National Interagency Fire Center (NIFC) tracks US wildfire activity by both number of fires and acres burned. Through the current year-to-date period in 2026, the United States has recorded 42,651 fires burning a combined 4,510,189 acres — both the highest totals for this point in the year since 2016.
What the DSCI Shows
Climatecrisis247 measured national drought severity using the U.S. Drought Monitor and produced a Drought Severity and Coverage Index (DSCI) for 2000–2025. The DSCI compresses multiple drought categories into a single 0–500 score by weighting the percentage of land in each category (D0–D4) by that category's severity. Annual values ranged from a low of 44 in 2010 to a high of 151 in 2022. Because the DSCI is calculated weekly, it provides a practical way to compare drought pressure across weeks, seasons and years.
High drought scores help explain some of the variability in burned acreage, but drought alone does not fully account for the largest burn years. A single extremely large complex fire can skew national totals — for example, the East Amarillo Complex fires in Texas (2006) burned just over 900,000 acres by themselves.
Rankings (2000–2025)
- 2006 — Fires: 96,385; Acres: 9,873,745; Avg DSCI: 93.8
- 2000 — Fires: 92,250; Acres: 7,393,493; Avg DSCI: 79.4
- 2007 — Fires: 85,705; Acres: 9,328,045; Avg DSCI: 103.2
- 2001 — Fires: 84,079; Acres: 3,570,911; Avg DSCI: 76.7
- 2008 — Fires: 78,979; Acres: 5,292,468; Avg DSCI: 77.9
- 2009 — Fires: 78,792; Acres: 5,921,786; Avg DSCI: 54.6
- 2025 — Fires: 77,850; Acres: 5,131,474; Avg DSCI: 105.1
- 2011 — Fires: 74,126; Acres: 8,711,367; Avg DSCI: 91.2
- 2002 — Fires: 73,457; Acres: 7,184,712; Avg DSCI: 128.9
- 2010 — Fires: 71,971; Acres: 3,422,724; Avg DSCI: 44.4
- 2017 — Fires: 71,499; Acres: 10,026,086; Avg DSCI: 45.2
- 2022 — Fires: 68,988; Acres: 7,577,183; Avg DSCI: 150.7
- 2015 — Fires: 68,151; Acres: 10,125,149; Avg DSCI: 93.9
- 2012 — Fires: 67,774; Acres: 9,326,238; Avg DSCI: 141.4
- 2016 — Fires: 67,743; Acres: 5,509,995; Avg DSCI: 63.8
- 2005 — Fires: 66,753; Acres: 8,689,389; Avg DSCI: 69.2
- 2004 — Fires: 65,461; Acres: 8,097,880; Avg DSCI: 104.0
- 2024 — Fires: 64,897; Acres: 8,924,884; Avg DSCI: 79.1
- 2003 — Fires: 63,629; Acres: 3,960,842; Avg DSCI: 129.4
- 2014 — Fires: 63,312; Acres: 3,595,613; Avg DSCI: 98.7
- 2021 — Fires: 58,985; Acres: 7,125,643; Avg DSCI: 146.7
- 2020 — Fires: 58,950; Acres: 10,122,336; Avg DSCI: 82.6
- 2018 — Fires: 58,083; Acres: 8,767,492; Avg DSCI: 85.6
- 2023 — Fires: 56,580; Acres: 2,693,910; Avg DSCI: 93.4
- 2019 — Fires: 50,477; Acres: 4,664,364; Avg DSCI: 35.8
- 2013 — Fires: 47,579; Acres: 4,319,546; Avg DSCI: 133.7
Takeaway: The opening months of 2026 have been exceptionally hazardous on both sides of the Atlantic — US wildfire activity is moving at a record pace for this point in the year, while the blazes in Europe are among the worst in modern regional history.
Photo: Emma Renly / Unsplash
Help us improve.