The Pacific Institute rescaled U.S. rivers so widths reflect average discharge, producing a map where the Mississippi overwhelms the landscape at about 593,000 cfs. The top five rivers by flow in the contiguous U.S. are Mississippi, Ohio, Columbia, Atchafalaya, and Missouri. The map highlights how discharge differs from length (the Missouri can be longer but far less voluminous) and shows human and climate impacts on western rivers like the Colorado and Rio Grande.
Mapped by Flow: How U.S. Rivers Reshape When Scaled by Water Volume
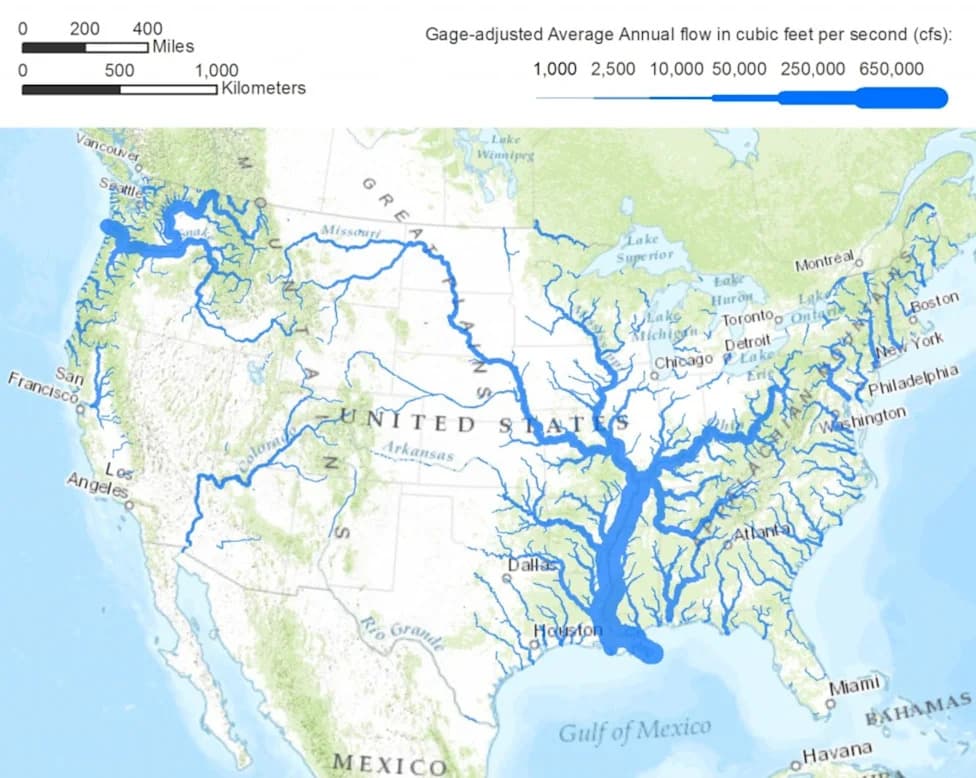
U.S. rivers resized on a map based on their flows
A visualization from the Pacific Institute redraws major U.S. rivers so their widths represent average discharge — the volume of water passing a point per second — rather than geographic length or course. The effect is striking: the Mississippi system balloons across the central and eastern United States, while many western rivers shrink to thin threads.
Mississippi Dominance: The Mississippi carries an average of 593,000 cubic feet per second (cfs), more than twice the flow of the Ohio River. That immense volume makes the Mississippi the dominant feature on the flow-adjusted map, reflecting both its large drainage basin and its enormous discharge.
Top Five Rivers by Average Discharge (Contiguous U.S.)
- 1. Mississippi
- 2. Ohio
- 3. Columbia
- 4. Atchafalaya
- 5. Missouri
The Mississippi ranks first in North America by annual flow and is the world’s seventh most powerful river by that measure. The list also underscores an important distinction between river length and discharge: by some measures the Missouri is longer than the Mississippi, yet it carries only a fraction of the Mississippi’s water.
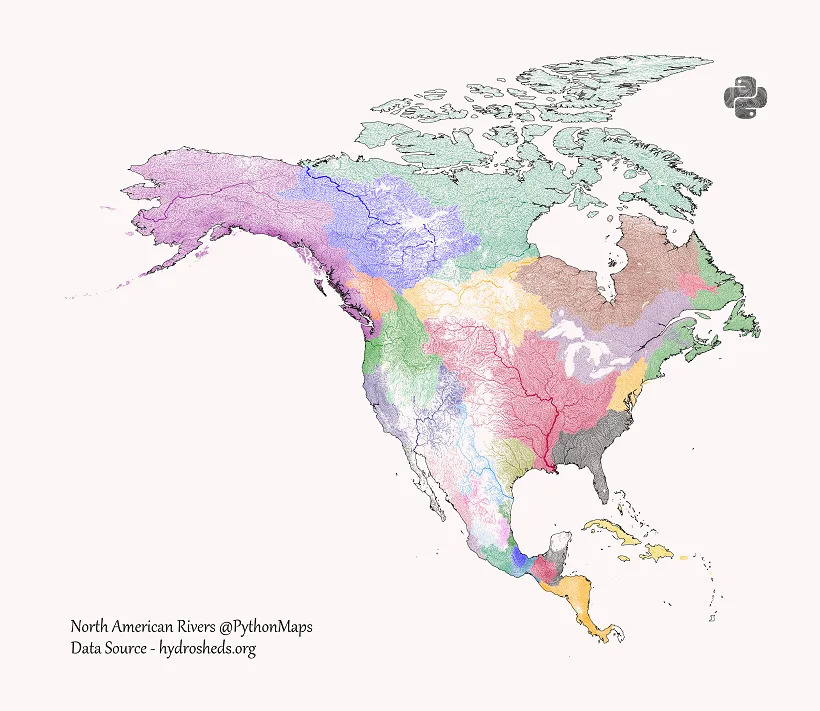
River basins of North America
Of the five rivers above, only the Columbia lies outside the Mississippi River system. The Ohio and Missouri are tributaries that feed the Mississippi; the Atchafalaya is a distributary that diverts a large portion of the Mississippi’s flow into Louisiana’s coastal system.
East Versus West
One of the map’s clearest contrasts is the dense, water-rich network of rivers across the eastern United States compared with the much thinner waterways of the West. The Columbia is the major western standout, and its full system is larger than depicted because many significant tributaries extend into Canada.
Human and Climatic Impacts
The Pacific Institute highlights how human use and climate change reshape river flows. The Colorado River becomes noticeably weaker as it approaches the ocean, largely due to extensive withdrawals for cities and agriculture. The Rio Grande — which forms much of the U.S.–Mexico border — is barely visible on the flow-adjusted map; once much more powerful, it now struggles in places to reach the sea after decades of water withdrawals and the effects of a warming climate.
For a complementary perspective, the visualization links to a map of North American river basins by Adam Symington, which outlines continental drainage regions and helps explain why some systems dominate the flow-adjusted view.
Note: All discharge values are average estimates (cubic feet per second) used for the Pacific Institute’s visualization and may vary year-to-year with seasonal conditions and longer-term climate trends.
Help us improve.