The carbon intensity of electricity generation varies widely across U.S. states in 2024, driven by how much coal, petroleum, or clean energy they produce. Vermont leads with nearly 100% renewable in-state generation, while West Virginia, Kentucky, and Wyoming are the most carbon-intensive because of coal. Nationwide, power-sector emissions fell roughly 40% from 2005 to 2024, though Idaho and Vermont did not follow that decline. Growing data-center demand and recent federal policy rollbacks pose challenges, increasing the role states must play in the clean-energy transition.
How Clean Is the Power in Your State? A 2024 Map of Carbon Intensity
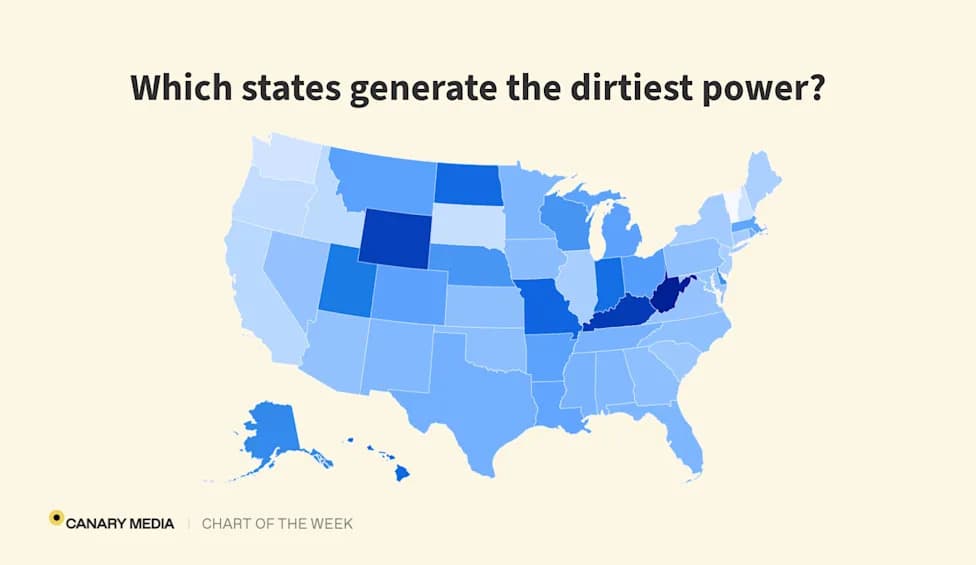
How dirty is the power generated in your state?
Have you ever looked at a power line and wondered how clean the electrons flowing through it actually are? The answer depends a lot on where you are. A new 2024 federal dataset compiled by U.S. Energy Data (from the Institute for Progress) maps the carbon intensity of in-state electricity generation across the United States.
What the Map Shows
Carbon intensity measures the tons of carbon dioxide (and equivalent greenhouse gases) emitted per megawatt-hour (MWh) of electricity generated. The map’s range of blues highlights dramatic differences between states: some still rely heavily on coal and petroleum, while others get most generation from low- or zero-carbon sources like wind, solar, hydro, and nuclear.
Dirtiest and Cleanest States
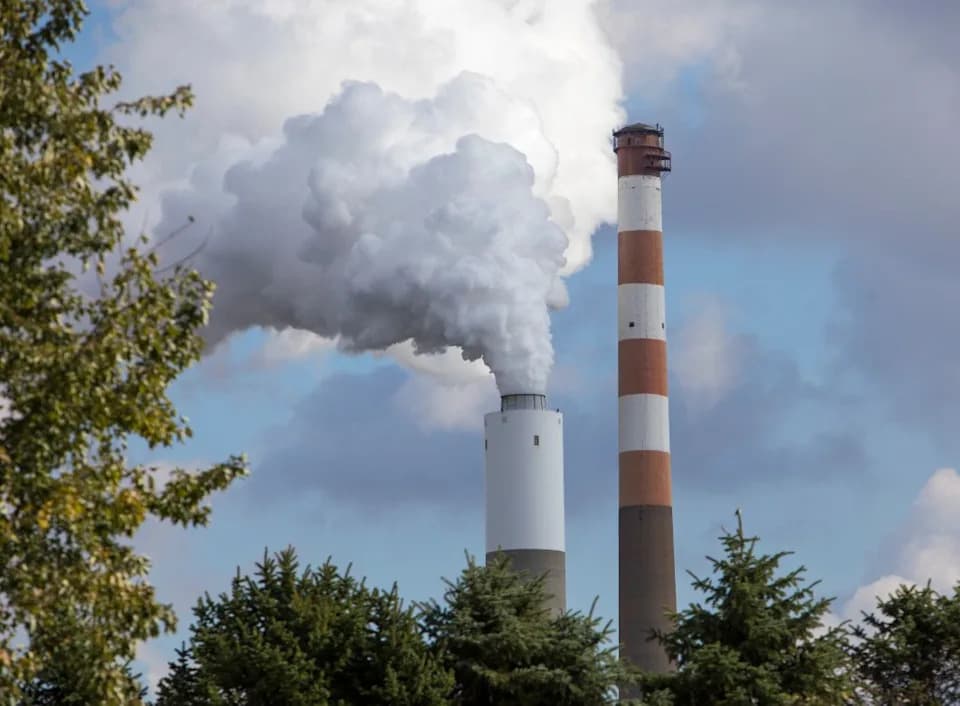
The states with the highest carbon intensity — notably West Virginia, Kentucky, and Wyoming — generate much of their electricity by burning coal. That reflects their large in-state coal industries and coal-fired power fleets. By contrast, Vermont tops the list for the cleanest in-state generation, producing essentially 100% of its in-state electricity from renewables (largely hydropower) for several years.
Generation vs. Consumption
Importantly, the map shows generation occurring inside each state, not what residents actually consume. Electricity flows across regional transmission lines, so a state that exports a lot of clean power can still be served locally by imported, carbon-intensive electricity. For example, Wyoming generates roughly 12 times more electricity than it consumes.
National Trends and Drivers
There is encouraging progress: greenhouse gas emissions from the U.S. power sector fell by about 40% between 2005 and 2024. That decline reflects coal plant retirements and the growth of cheaper natural gas and renewable generation. According to the dataset, generation became less carbon-intensive in every state except Idaho and Vermont over that period.
Challenges Ahead
States aiming for fully clean grids by midcentury face headwinds. Rapidly growing electricity demand from data centers is driving investment in new gas-fired capacity in some regions, and recent federal policy rollbacks have reduced some national-level climate policy support while signaling continued backing of fossil-fuel industries. As a result, the responsibility for sustaining the clean-energy transition increasingly falls to states, utilities, and local stakeholders.
Bottom line: Where you live matters for how carbon-intensive the electricity produced in your state is, but transmission, imports, and policy choices determine how clean the power you actually use will be.
Help us improve.