The longest satellite-based synthesis to date finds Greenland and Antarctica lost about 11.3 trillion tons of ice from 1979–2023, raising global sea levels by roughly 1 inch (3 cm). Researchers combined 42 independent satellite records and report that about 84% of the loss came from glaciers accelerating into the ocean and 16% from surface melt. Greenland’s pronounced losses in the 2010s were driven by extreme summer melt events, while Antarctic declines reflect faster outlet glaciers, especially in West Antarctica. A slight slowdown from 2020–2023 did not change the long-term trend, and regional estimates are planned to improve projections and local planning.
Longest Satellite Record Shows Greenland and Antarctica Lost 11.3 Trillion Tons of Ice (1979–2023)
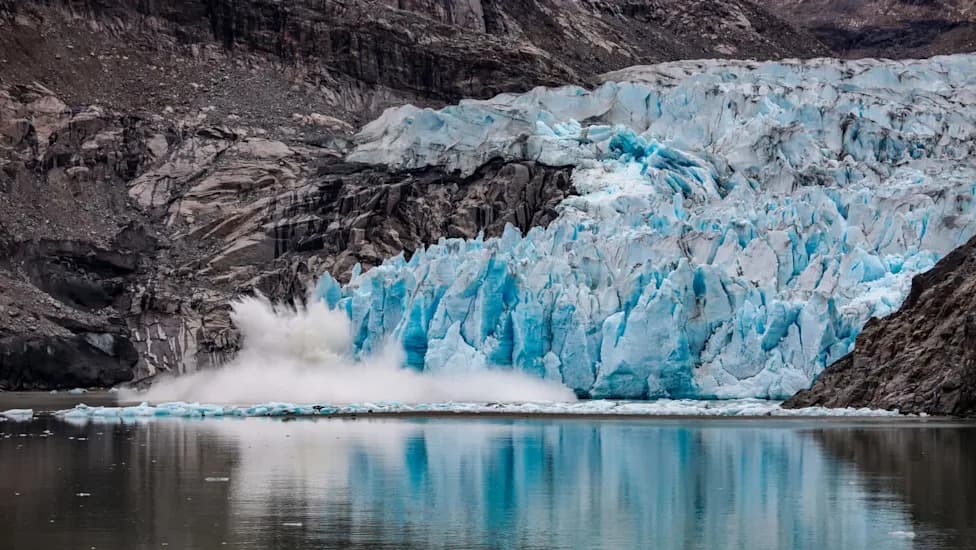
Photo Credit: iStock
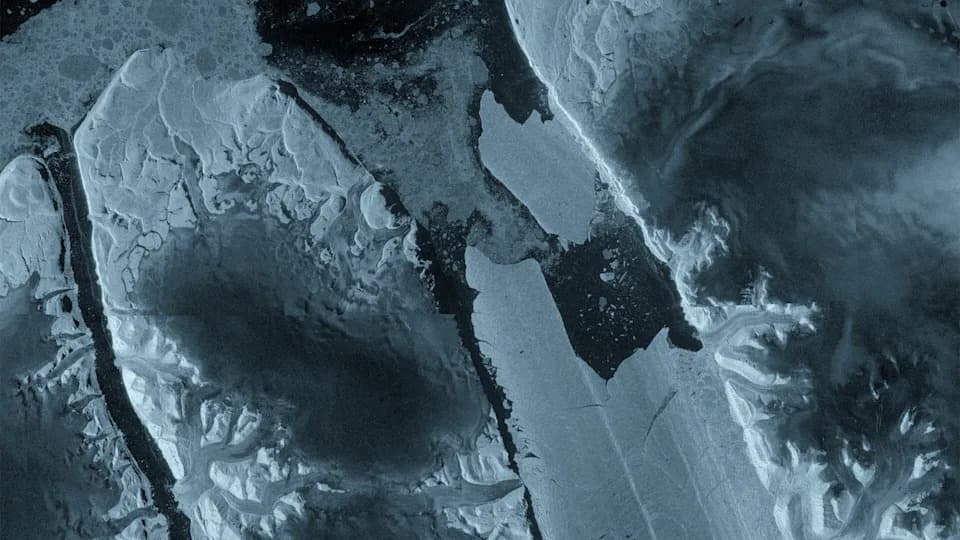
For decades the Greenland and Antarctic ice sheets have thinned, and a new synthesis of satellite data puts the scale of that decline into sharp focus. Researchers combined 42 independent satellite-based estimates of ice-sheet mass balance to produce the longest and most comprehensive record yet, concluding that Greenland and Antarctica shed about 11.3 trillion tons of ice between 1979 and 2023.
What the Record Shows
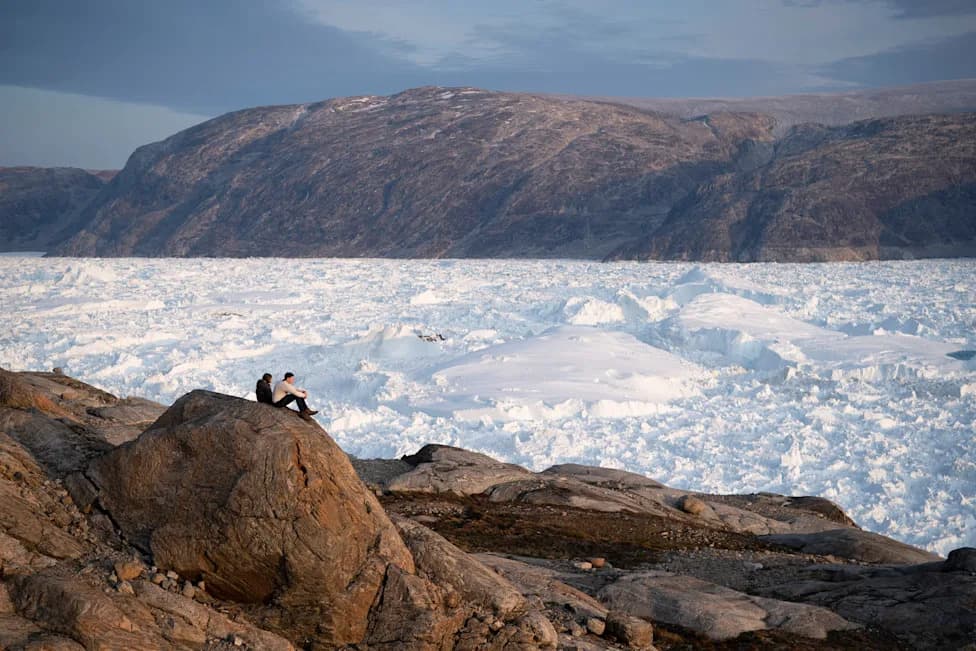
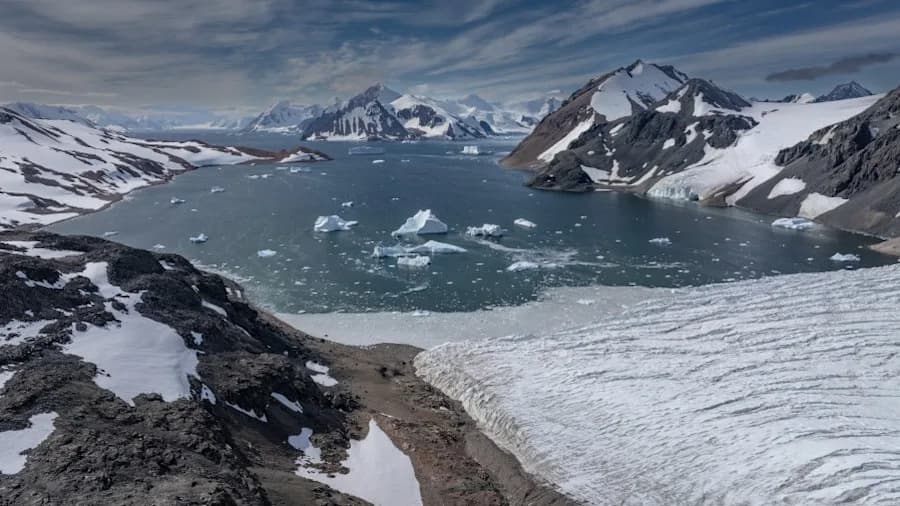
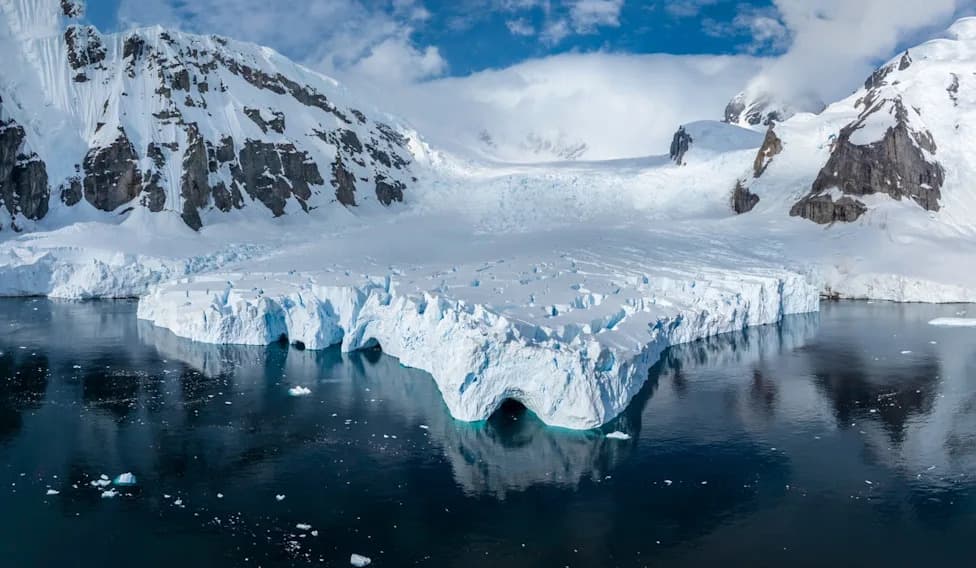
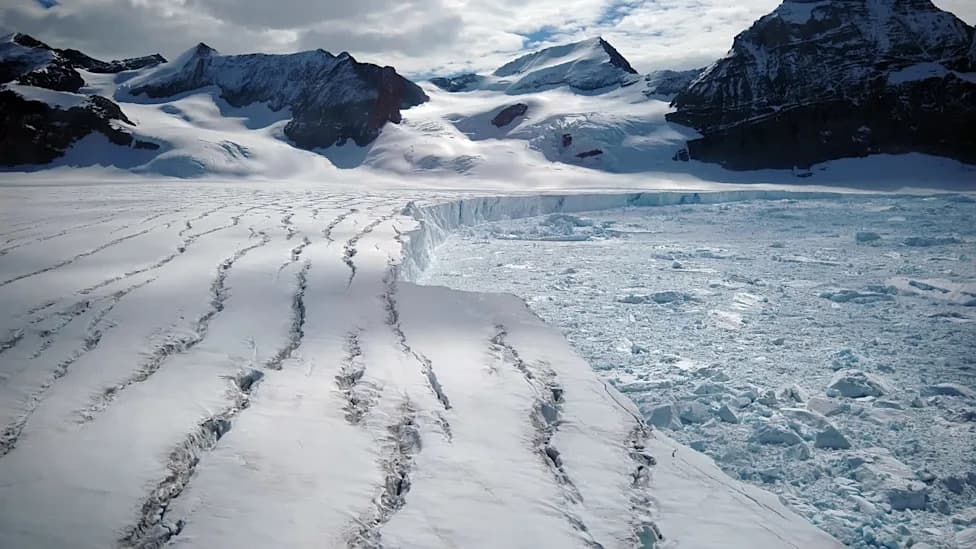
The combined ice loss lifted global average sea levels by roughly 1 inch (≈3 cm) and now accounts for about one-quarter of observed global sea-level rise. The rate of loss accelerated over time: Greenland experienced especially large declines in the 2010s driven by extreme summer melt events, while Antarctica’s mass loss has been dominated by faster-flowing outlet glaciers—particularly in West Antarctica—exporting ice to the ocean.
How the Ice Was Lost
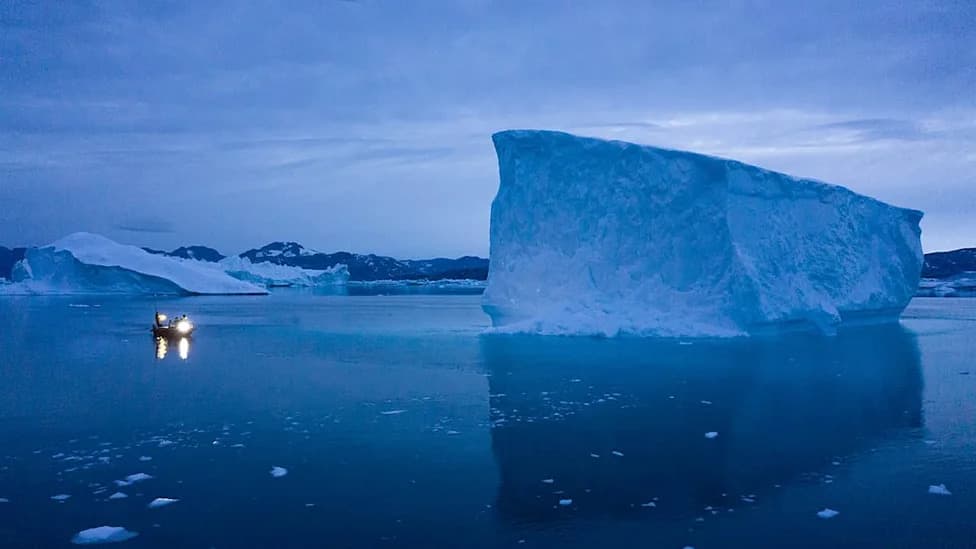
A key finding is that most mass loss came from glacier dynamics rather than surface melting: the team estimates about 84% of the combined loss resulted from glaciers speeding up and delivering ice to the sea, while only about 16% came from surface melt. That imbalance implicates ocean-driven processes—such as warmer seawater undermining glacier fronts—as major destabilizing forces and suggests much of the change may be difficult to reverse quickly even if atmospheric conditions temporarily cool.
“What we really wanted to do is to produce a very comprehensive and robust estimate. By combining all of those different independent estimates, we can then come up with one dataset and assessment of how the ice sheets have evolved over the past five decades.” — Inès Otosaka, lead author
Recent Trends and Regional Plans
The record shows a modest slowdown in total losses from 2020–2023, helped by record snowfall in East Antarctica and milder summers in Greenland, but the multi-decade trend of net ice loss continues. The research team plans to break down the dataset region by region to identify which sectors of Greenland and Antarctica are changing most rapidly and why—information that can sharpen sea-level projections and support local adaptation planning.
Why This Matters
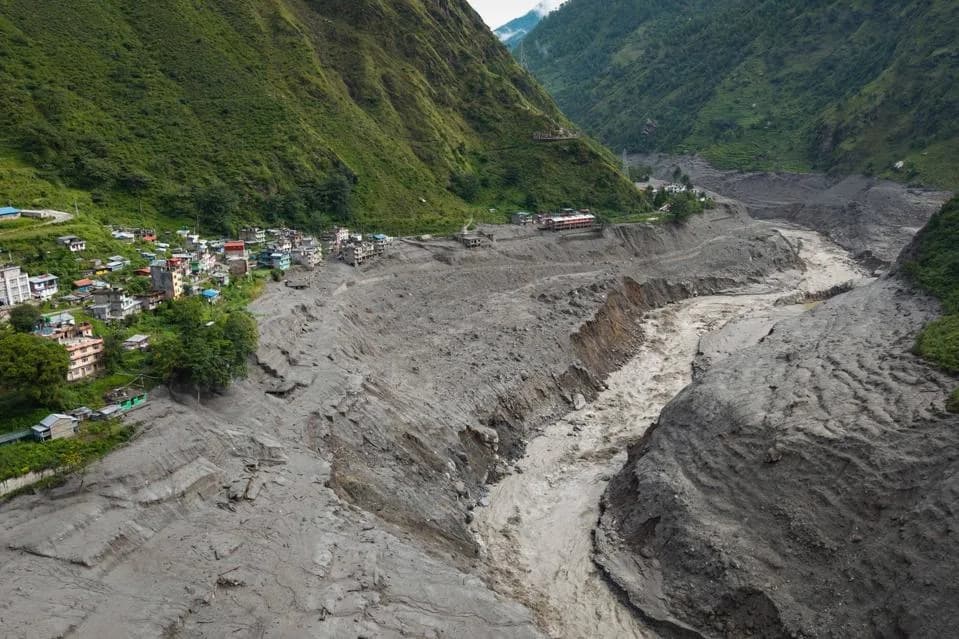
Rising seas amplify coastal flooding, strain drainage systems, damage infrastructure and property, and raise recovery costs for vulnerable communities. Better, longer observational records—combining ice motion, volume change and gravity measurements—give planners and policymakers clearer guidance on likely sea-level changes and where to prioritize protective and adaptive measures.
To put the loss in perspective: Otosaka noted the total is enough ice to fill a cube roughly 23 kilometers (14 miles) on a side. The study underscores that glacier acceleration into the ocean, driven largely by oceanic and dynamic processes, has been the dominant source of polar ice-sheet mass loss recorded by satellites since 1979.
Help us improve.