A Durham and Lancaster study finds the US military among the world’s largest climate polluters; if it were a country, it would rank about 47th in greenhouse gas emissions. Military aircraft—especially heavy bombers and large cargo planes—are the single biggest sources of CO2 per hour due to very high fuel burn. By contrast, nuclear-powered aircraft carriers and submarines produce little operational CO2. Reliable, centralized data on per-weapon fuel use are limited, complicating mitigation and policy planning.
Which US Weapons Produce the Most Pollution? Aircraft Lead the Military’s Carbon Footprint
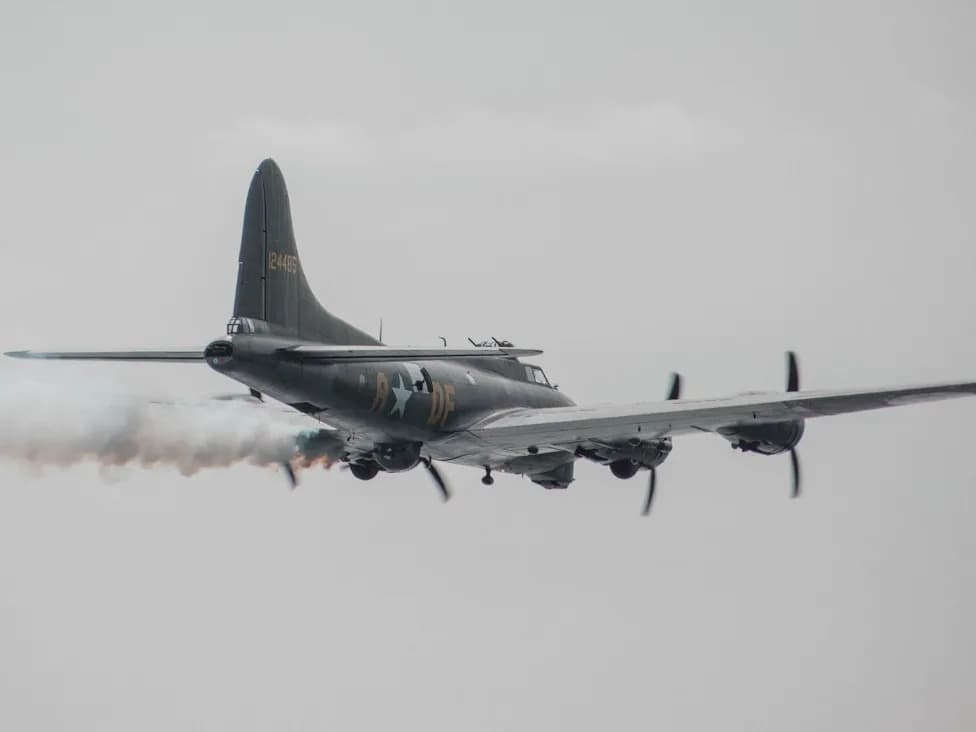
Photo by Jimmyk photos on Pexels
A report co-authored by researchers at Durham and Lancaster universities describes the US military as “one of the largest climate polluters in history,” noting it consumes vast quantities of liquid fuels and emits more CO2e (carbon-dioxide equivalent) than many countries. If treated as a single country, the US military would rank roughly 47th in the world for greenhouse gas emissions.
The scale of military energy use is striking: one recent study and related analysis in the book The Pentagon, Climate Change, and War: Charting the Rise and Fall of US Military Emissions estimate that the armed forces account for nearly 80% of the US federal government’s total energy consumption. Given the logistics, bases, vehicles, ships, aircraft and personnel involved, this large footprint is perhaps unsurprising—but the distribution of emissions across platforms is notable.
Some of the largest Navy platforms produce very little operational CO2 because they are nuclear-powered. The Gerald R. Ford–class aircraft carriers and all US Navy submarines rely on nuclear propulsion, which means their underway fuel-related CO2 emissions are minimal compared with conventional-fueled ships and aircraft.
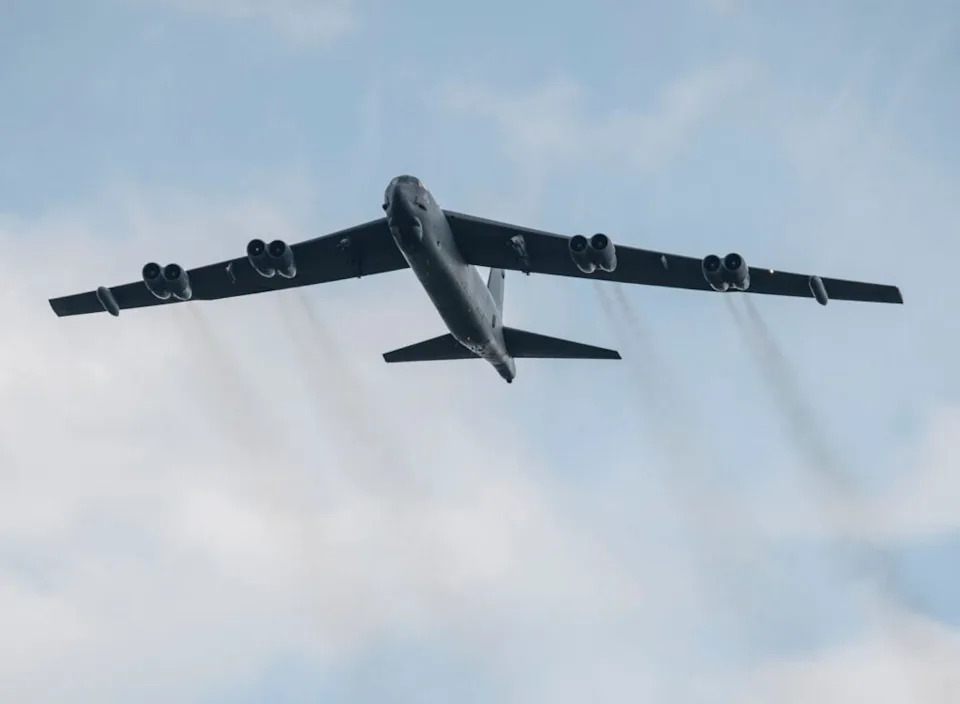
Photo byMike KutzonPexels
Which Platforms Emit the Most?
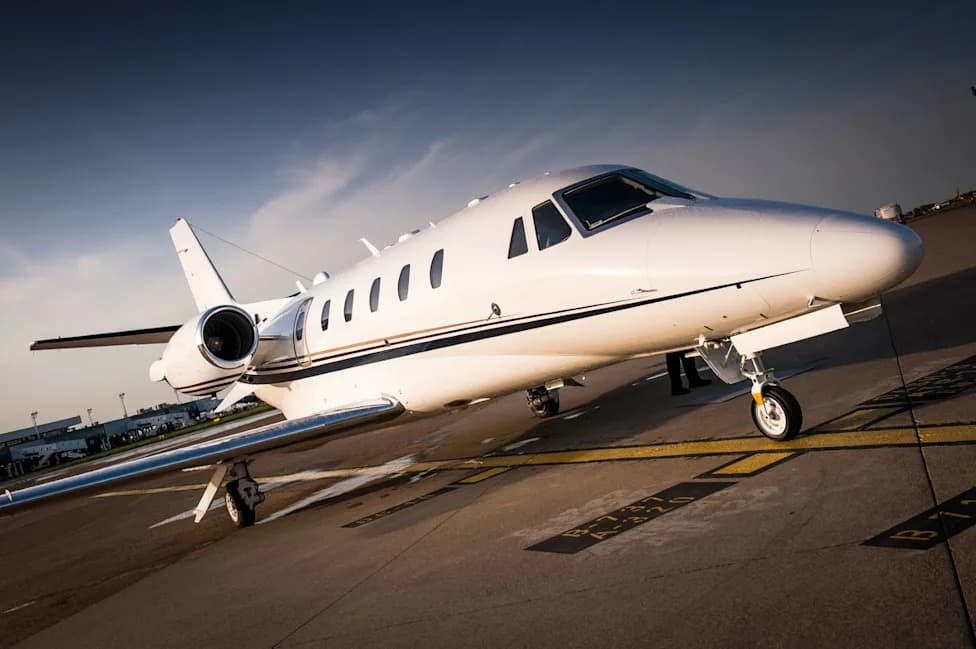
By mass and hourly fuel burn, military aircraft are the biggest emitters. Heavy bombers and large cargo planes burn thousands of gallons per hour and therefore release the most CO2 per hour of operation. Exact, consistently reported per-platform fuel and emissions figures do not exist in a single public database—available estimates are compiled from media reports, defense-focused outlets, academic studies, the Congressional Budget Office, the Department of Defense, and think tanks.
Representative Aircraft Fuel Use and CO2 Estimates
| Aircraft | Fuel Burn (Gallons / Hour) | Approx. CO2 (US Tons / Hour) |
|---|---|---|
| B-52H Bomber | ~3,300 | ~35 |
| B-1B Bomber | ~2,700–3,300 | ~29–35 |
| C-17 Globemaster III (Cargo) | ~2,200–3,000 | ~24–32 |
| F-35A Fighter | ~1,500 | ~16 |
| KC-135R Tanker | ~1,300–1,500 | ~14–16 |
| F-16 Fighter | ~900 | ~10 |
| C-130 Hercules (Cargo) | ~750 | ~8 |
Interpret these figures cautiously: numbers are approximate and depend on mission profile, payload, throttle setting, and aircraft configuration. The values above represent commonly cited operational averages used in press reports and technical summaries.
What This Means and Next Steps
The military’s emissions profile highlights two facts: aircraft operations are a major source of fuel consumption and CO2 emissions, and data transparency is limited. Reducing the military’s climate impact will require better measurement, reporting and targeted investments in cleaner fuels, efficiency improvements, and alternative propulsion where feasible. Policymakers and researchers also call for centralized, consistent accounting so comparisons and mitigation planning can be more effective.
Photo credit: Mike Kutzon / Pexels (used as illustrative image)
Help us improve.