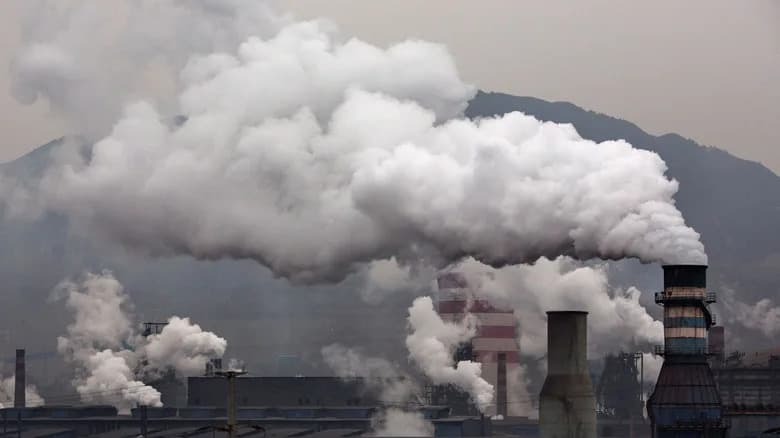
Key findings: International aviation and shipping emitted about 1.4 billion metric tonnes of greenhouse gases in 2025, roughly 2.6% of global emissions. If counted as a single country, this sector would rank among the world’s top emitters—larger than Australia and nearly four times the United Kingdom. China, the United States and India are the top three national emitters in 2025. The report uses EDGAR emissions data and World Bank population estimates to compare country and sector totals.
Beyond Borders: Aviation & Shipping Versus the World's Top Emitters (2025)

Photo by Alexander Bobrov on Pexels
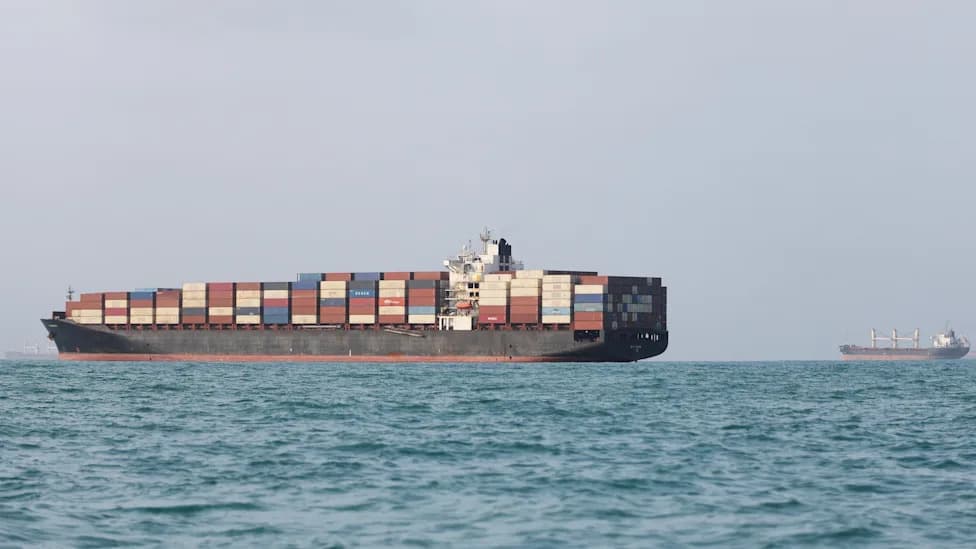
Transportation is the single largest source of greenhouse gas emissions in the United States and a major contributor globally. Around 100,000 flights take off and land each day—about 1.2 flights every second—according to the World Economic Forum. More than 80% of global trade moves by sea, and shipping data provider MagicPort reports that as many as 100,000 cargo vessels (bulk carriers, container ships and tankers) may be at sea at any one time.
International aviation and shipping (excluding overland transport) emitted roughly 1.4 billion metric tonnes of greenhouse gases in 2025, about 2.6% of global emissions. Both sectors saw a sharp decline in 2020 during the first year of the COVID-19 pandemic, but emissions have rebounded: aviation and shipping emissions rose by 3.3% year-on-year (2024–2025) and by nearly 13% over the decade (2015–2025).
Put another way, the combined carbon footprint of international sea and air traffic exceeds the emissions of most countries. It produces more than double the greenhouse gases of Australia and nearly four times those of the United Kingdom. If treated as a single country, international aviation and shipping would rank among the world’s largest emitters.
This analysis uses 2025 emissions data from the European Commission’s Emissions Database for Global Atmospheric Research (EDGAR). Climate Crisis 247 ranked the top 10 emitters in 2025 and included international aviation and shipping as a separate entry. Population figures (where applicable) are 2025 estimates from the World Bank. All figures below are presented in billion metric tonnes (GtCO2e), with the equivalent in million metric tonnes for clarity.
10. Saudi Arabia
Emissions (2025): 0.845 billion metric tonnes (845 million) — 1.6% of the global total
1‑year change (2024–2025): +1.3% (+10.6 million metric tonnes)
10‑year change (2015–2025): +11.9% (+90.0 million metric tonnes)
Population (2025): 36,973,555
9. Japan
Emissions (2025): 1.10 billion metric tonnes (1,100 million) — 2.0% of the global total
1‑year change (2024–2025): −1.4% (−15.5 million metric tonnes)
10‑year change (2015–2025): −19.9% (−263.6 million metric tonnes)
Population (2025): 123,366,734
8. Iran
Emissions (2025): 1.10 billion metric tonnes (1,100 million) — 2.1% of the global total
1‑year change (2024–2025): +1.7% (+18.8 million metric tonnes)
10‑year change (2015–2025): +40.2% (+320.9 million metric tonnes)
Population (2025): 92,417,681
7. Brazil
Emissions (2025): 1.30 billion metric tonnes (1,300 million) — 2.4% of the global total
1‑year change (2024–2025): −0.9% (−11.4 million metric tonnes)
10‑year change (2015–2025): +5.9% (+72.3 million metric tonnes)
Population (2025): 212,812,405
6. Indonesia
Emissions (2025): 1.40 billion metric tonnes (1,400 million) — 2.5% of the global total
1‑year change (2024–2025): +1.2% (+16.1 million metric tonnes)
Photo byWolfgang WeiseronUnsplash
10‑year change (2015–2025): +53.6% (+474.4 million metric tonnes)
Population (2025): 285,721,236
5. International Aviation and Shipping
Emissions (2025): 1.40 billion metric tonnes (1,400 million) — 2.6% of the global total
1‑year change (2024–2025): +3.3% (+44.9 million metric tonnes)
10‑year change (2015–2025): +12.8% (+157.8 million metric tonnes)
Population (2025): N/A
4. Russia
Emissions (2025): 2.60 billion metric tonnes (2,600 million) — 4.8% of the global total
1‑year change (2024–2025): −0.1% (−3.3 million metric tonnes)
10‑year change (2015–2025): +14.8% (+332.6 million metric tonnes)
Population (2025): 143,513,328
3. India
Emissions (2025): 4.50 billion metric tonnes (4,500 million) — 8.3% of the global total
1‑year change (2024–2025): −0.2% (−6.8 million metric tonnes)
10‑year change (2015–2025): +36.8% (+1.2 billion metric tonnes)
Population (2025): 1,463,865,525
2. United States
Emissions (2025): 6.00 billion metric tonnes (6,000 million) — 11.1% of the global total
1‑year change (2024–2025): +2.2% (+131.5 million metric tonnes)
10‑year change (2015–2025): −5.1% (−322.0 million metric tonnes)
Population (2025): 341,784,857
1. China
Emissions (2025): 16.00 billion metric tonnes (16,000 million) — 29.5% of the global total
1‑year change (2024–2025): +0.1% (+9.7 million metric tonnes)
10‑year change (2015–2025): +22.3% (+2.9 billion metric tonnes)
Population (2025): 1,406,585,000
Takeaway: While a handful of countries account for the largest shares of global emissions, international aviation and shipping together represent a substantial and growing source of greenhouse gases. Tracking these sectors alongside national totals highlights the scale of emissions that cross borders and underscores the need for international cooperation and technology deployment to decarbonize transport.
Data sources: EDGAR (European Commission Emissions Database for Global Atmospheric Research) and World Bank population estimates, 2025.
Help us improve.