PACA is a browser-based tool that reconstructs ancient fossil locations by combining modern coordinates with geological ages and querying five established plate models. It returns per-model paleocoordinates, reports model disagreement metrics, and provides searchable CSVs plus interactive 3D globes and GLB exports. Validation against GPlates desktop reconstructions (142 sites) showed median spatial errors of 6.25–16.8 m and near-perfect concordance, while the open-source code is archived on Zenodo.
PACA Brings Deep‑Time Mapping to Your Browser — Reconstruct Fossil Locations Without Coding
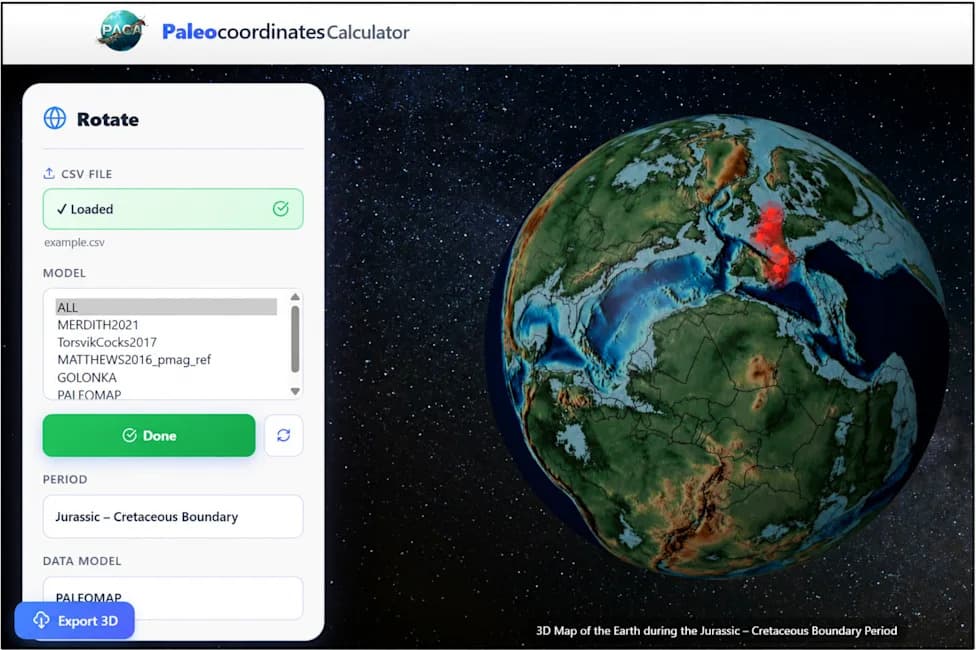
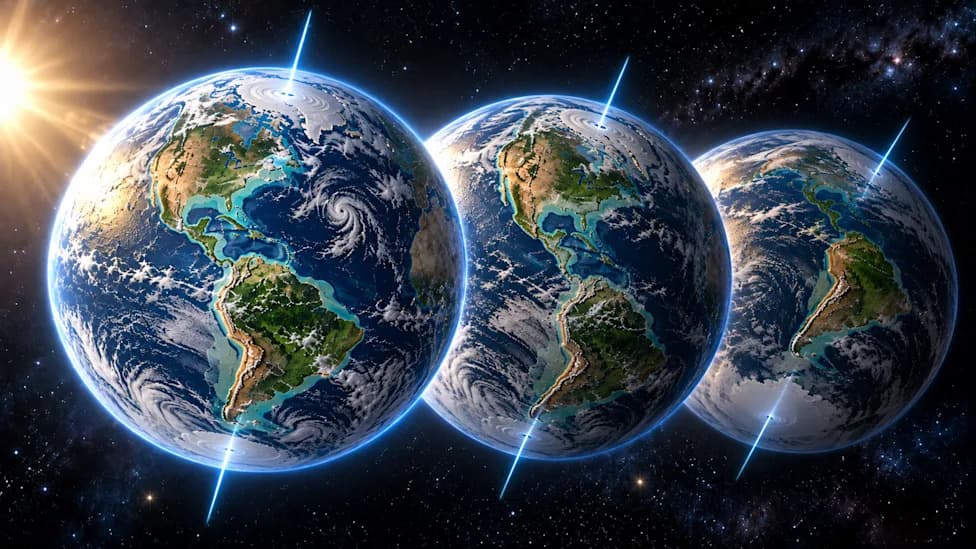
The Paleocoordinates Calculator reconstructs ancient fossil locations using five plate models, with errors below 17 metres. (CREDIT: University of Barcelona)
The Paleocoordinates Calculator (PACA) is a new browser-based tool that lets researchers, teachers and students quickly reconstruct where fossils and sampling points would have been on ancient Earth. By combining modern coordinates with geological ages and querying established plate models, PACA returns paleocoordinates, visualizations and downloadable data — all without installing desktop software or writing code.
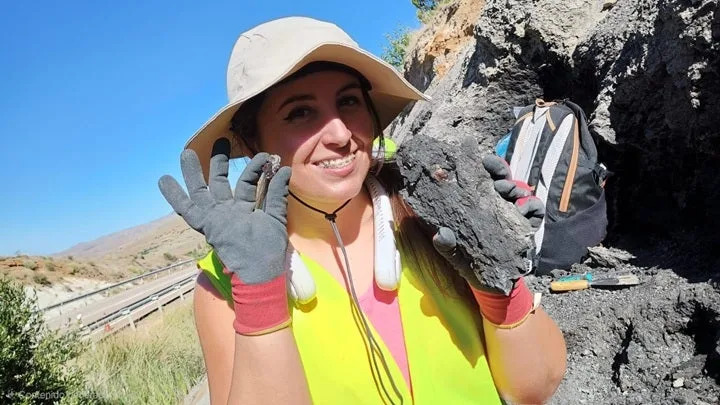
Noa Scholz-Murcia, first author of the article and a member of the Biodiversity Research Institute (IRBio) at the UB. (CREDIT: University of Barcelona)
How PACA Works
PACA accepts a CSV file with a record name, modern longitude and latitude, and minimum and maximum ages (in millions of years). The tool uses the arithmetic mean of the age range as the reconstruction date (users can instead enter identical min/max ages to test endpoints). Each input point is rotated individually through the GPlates Web Service via the palaeoverse R package, avoiding the spatial averaging of pre-calculated grids.
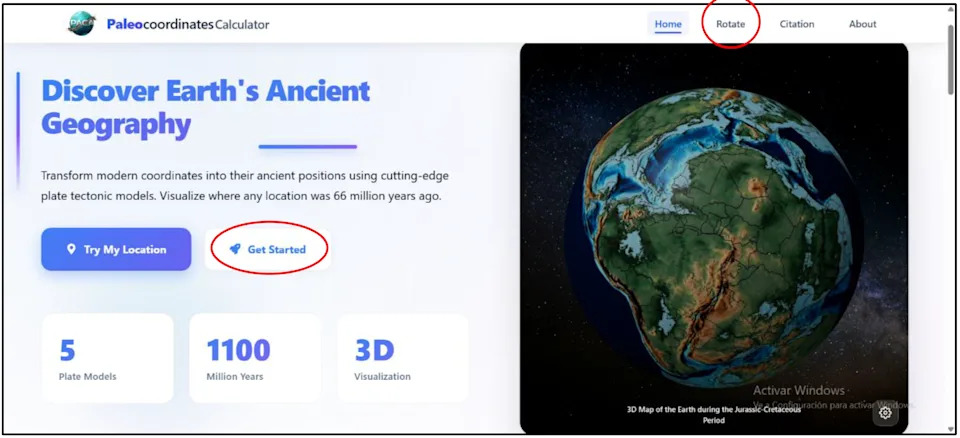
This innovative tool, the Paleocoordinates Calculator (PACA), will help to overcome the technological barrier to facilitate access to high-quality paleogeographic reconstructions.(CREDIT: University of Barcelona)
Models, Outputs and Visualization
The interface queries five widely used global plate models: PALEOMAP (Scotese), GOLONKA, MEREDITH2021, Torsvik & Cocks 2017, and MATTHEWS2016_pmag_ref. For each input, PACA returns a table with one row per model and reports two uncertainty metrics: the paleolatitudinal range across models and the maximum geographic distance (kilometres) between any two reconstructions.
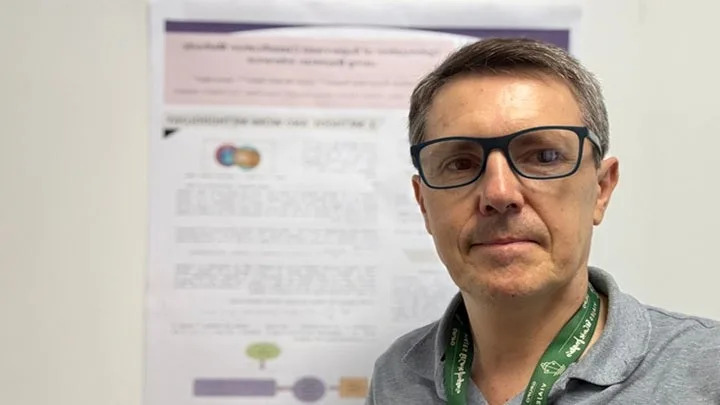
Antonio Monleón-Getino, head of the BIOST3 Research Group and member of the Bioinformatics Barcelona (BIB) platform. (CREDIT: University of Barcelona)
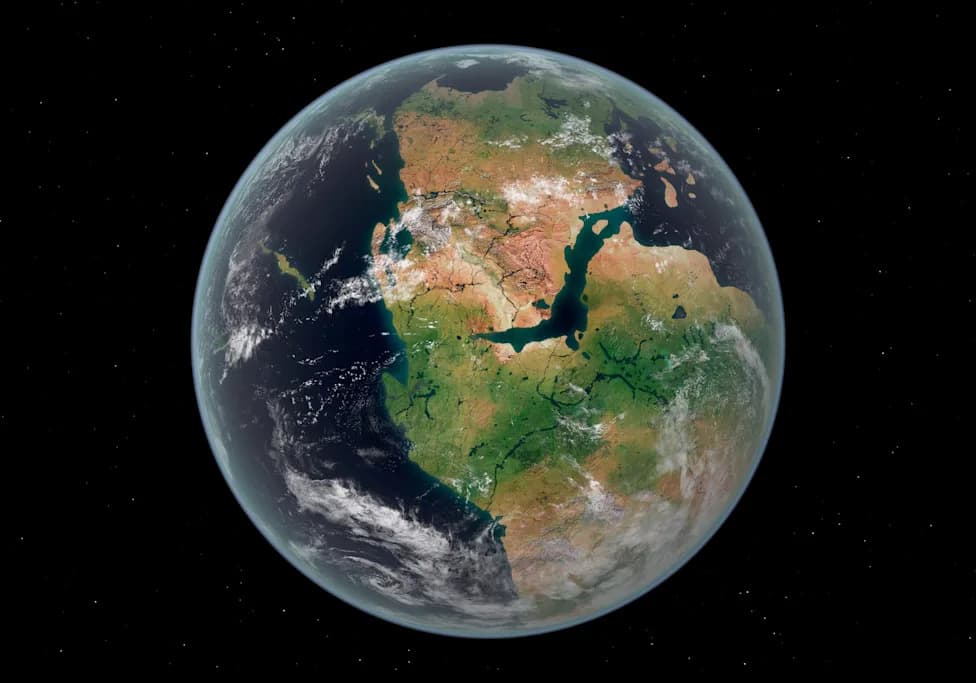
Results are presented in a searchable table that can be exported as CSV for statistical analysis. PACA also offers an interactive 3D viewer (built with React and Blender) that projects points onto paleogeographic maps from Christopher Scotese's PALEOMAP Project and aligns geological periods with the 2024 International Chronostratigraphic Chart. Users may export visualizations as GLB files for other 3D software.
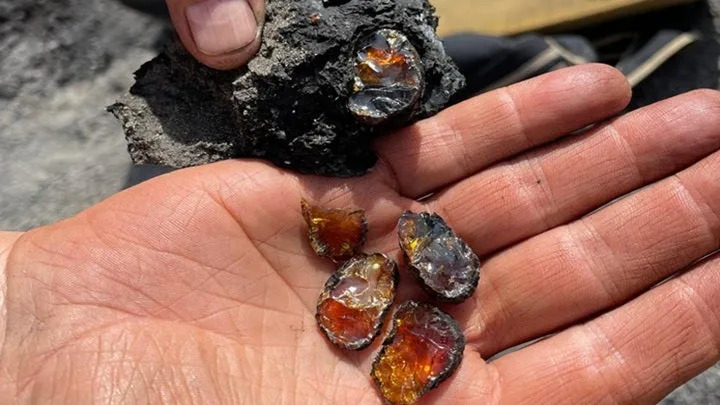
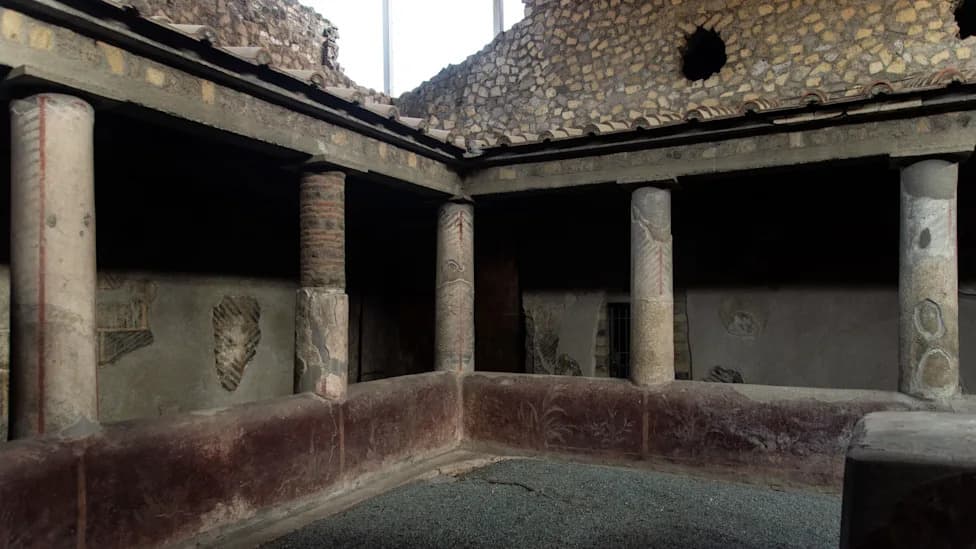
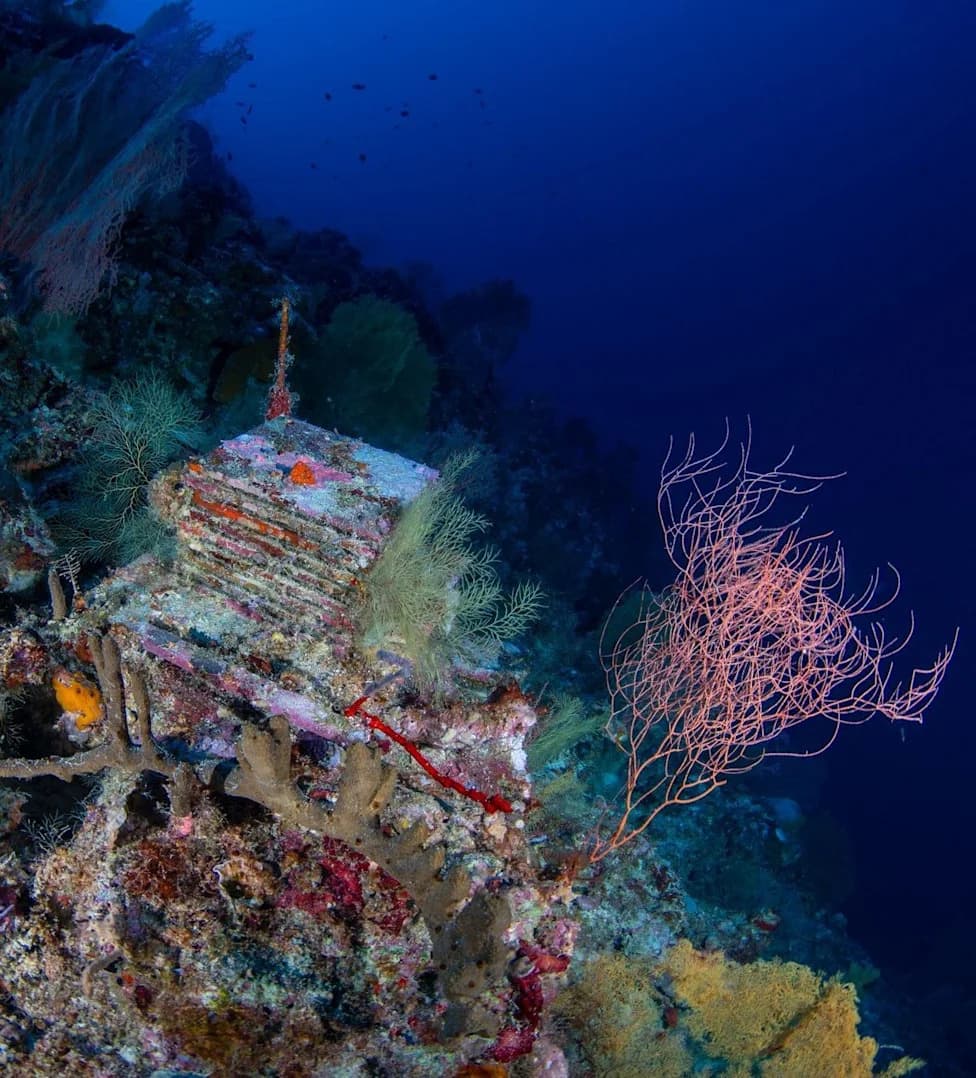
The PACA interface was designed as part of the research project "Cretaceous Resin Interval. Abiotic and biotic causes and their palaeoecological implications (CREI)". (CREDIT: Rafael Lozano (IGME-CSIC) / University of Barcelona)
Validation and Limitations
The BIOST3 Research Group at the University of Barcelona validated PACA against the standard GPlates desktop workflow using 142 fossil localities spanning a wide range of ages worldwide. Median spatial errors across the five models ranged from 6.25 m to 16.8 m — negligible compared with the typical tens-to-hundreds-of-kilometre uncertainties in plate reconstructions. The concordance correlation coefficient reached 1.000 for every model, indicating near-perfect agreement, and statistical tests found no systematic bias.
Some reconstructions failed because the requested ages lay outside a model's temporal limits or because plates were undefined at those times. These failures also occurred in the desktop workflow, showing they stem from model boundaries rather than the PACA interface. The validation additionally highlighted potential version differences in rotation files: earlier vs. newer paleomagnetic reference files produced notable longitudinal shifts for one model.
Practical Uses and Best Practices
PACA lowers the technical barrier to paleogeographic reconstruction and can be used to place fossil discoveries in original geographic contexts, compare ancient species ranges, test whether organisms crossed climate zones or tectonic boundaries, and explore correlations between tectonic uncertainty and extinction or palaeoclimate patterns.
The authors recommend recording the GPlates access date, the chosen plate model, and the reconstruction age, and preserving the downloaded CSV as a permanent record. Because PACA depends on live rotation files and web services, future updates could slightly change results; documenting provenance ensures reproducibility.
Availability and Credits
PACA's source code, conversion scripts and visualization files are archived on Zenodo to support reproducibility. The tool was developed by the BIOST3 Research Group (University of Barcelona) and described in the journal Scientific Reports. Key contributors include Noa Scholz-Murcia, Alejandro Rodríguez-Mena, Víctor Madarnás-Gómez and Antonio Monleón-Getino. Image and project credits in the original release include Rafael Lozano (IGME-CSIC) and the University of Barcelona.
Help us improve.