A new analysis led by Mathew Domeier (University of Oslo) and published in Science (2026) finds independent evidence that Earth's rigid outer shell — the crust and upper mantle — reoriented abruptly several times over the past 320 million years. Instead of relying primarily on paleomagnetic records, the team tracked global patterns of continental flooding and exposure at 10-million-year intervals, a signal expected when the solid Earth shifts relative to its rotation axis (true polar wander, or TPW).
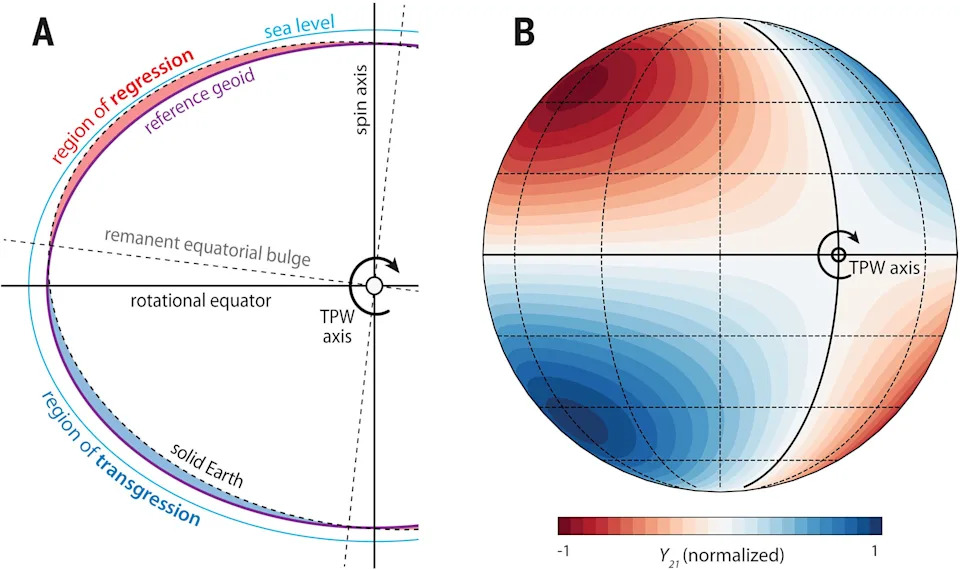
(A) Cross section of Earth (with exaggerated oblate form) showing displacement of the solid Earth's transient equatorial bulge (with respect to the reference geoid) during a TPW event. (B) Normalized response of degree-2, order-1 spherical harmonic (Y₂₁); nodal planes are highlighted in black. (CREDIT: Mathew Domeier et al, Science 2026)
How the Method Works
When the solid Earth reorients relative to the rotational bulge, oceans respond almost immediately while the deeper mantle and lithosphere adjust more slowly. That combination produces a distinctive four-lobed pattern of relative sea-level change: two broad regions of marine transgression (flooding) and two regions of regression (exposure). Domeier and colleagues compared successive global palaeogeographic maps to identify where shorelines advanced or retreated, then used logistic regression to test whether the spatial pattern matched TPW geometry rather than random or plate-tectonic-driven changes.
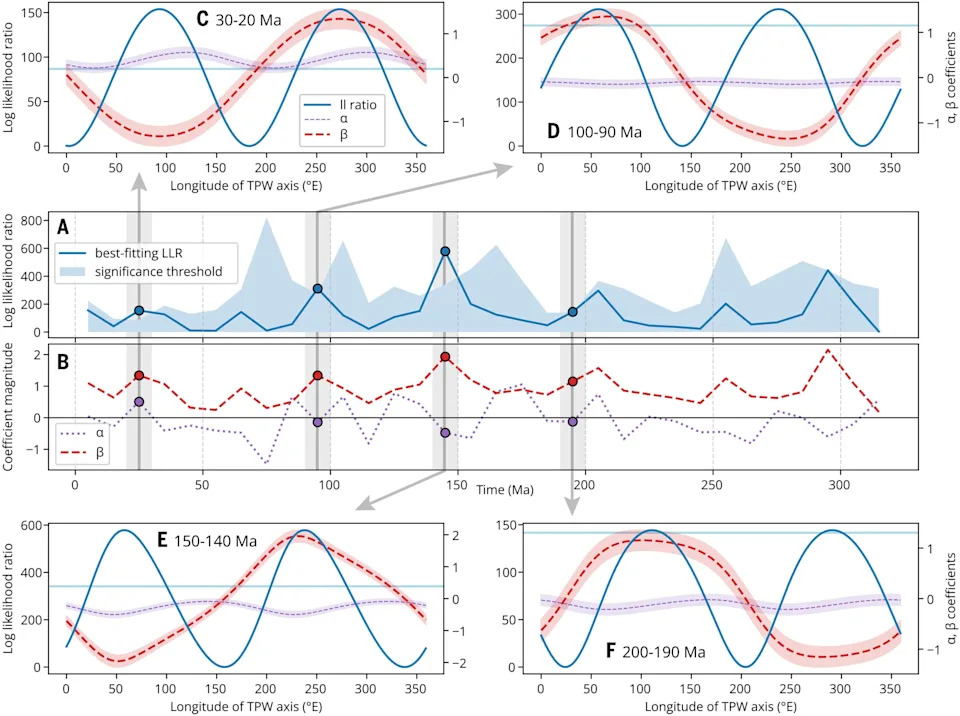
Estimated contributions of true polar wander (TPW) to sea-level change over the past 320 million years. The analysis identifies four intervals with significant TPW effects and estimates their contributions relative to global sea-level changes. (CREDIT: Mathew Domeier et al, Science 2026)
Key Findings
The authors identified four intervals that passed their statistical threshold: 200–190 Ma, 150–140 Ma, 100–90 Ma, and 30–20 Ma. Evidence was strongest for two Mesozoic episodes:
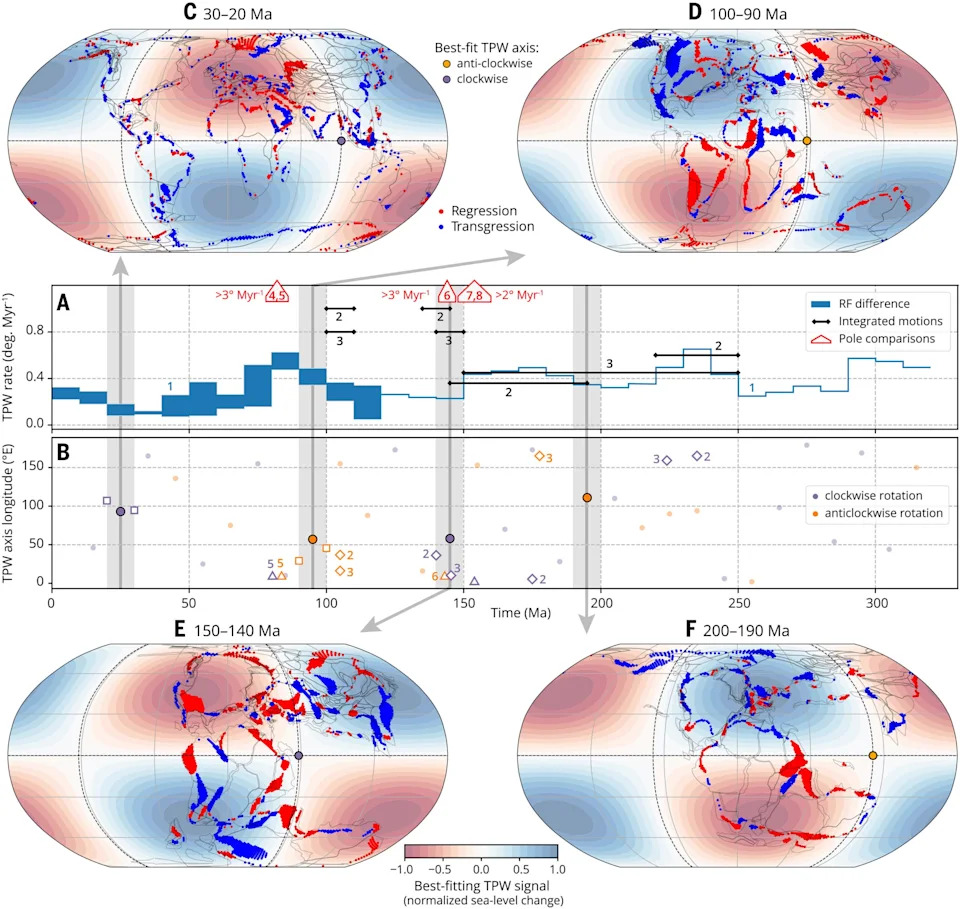
Estimates of true polar wander (TPW) over the past 320 million years compare its rate, direction, and rotation using plate-motion models, paleomagnetic data, and reference frames. Reconstructions map these changes against the best-fitting TPW axis. (CREDIT: Mathew Domeier et al, Science 2026)
- 150–140 million years ago (Late Jurassic–earliest Cretaceous): The best-fit model reconstructs a clockwise reorientation around an axis near 58°E, with transgression across parts of South America, Antarctica and eastern Asia and regression in southwestern North America, western Europe and eastern Australia. This interval aligns with some independent paleomagnetic and plate-reconstruction studies.
- 100–90 million years ago (mid–Late Cretaceous): The pattern indicates widespread regression in South America, western and southern Africa, and eastern Asia, with transgression in much of North America and Europe. The preferred fit suggests counterclockwise rotation about an axis near 53°E.
The 200–190 Ma window produced a marginal signal and a poorer fit to the expected geometry, so the authors treat it cautiously. The 30–20 Ma signal is weaker than the two primary Mesozoic events. Based on prior physical models, the patterns visible at a 10-million-year resolution generally imply TPW rates of order ~0.6° per million years or greater, which the authors classify as rapid on geological timescales.
Why This Matters
This sea-level based approach provides a largely independent test of TPW hypotheses, complementing paleomagnetic reconstructions that can be confounded by plate motions or drifting hotspots. Agreement between flooding patterns and some paleomagnetic results strengthens the case that at least two rapid Mesozoic reorientations occurred. If such TPW events were real and repeated, continents could have moved quickly through climate belts, producing large regional changes in temperature, precipitation and marine environments without requiring equivalent changes in atmospheric greenhouse gases.
Uncertainties and Contrasting Views
TPW remains debated. Some recent studies (for example, AGU Advances, 2025) reconstruct large but generally slow TPW for the past 320 Myr and find no support for rapid Jurassic–Cretaceous oscillations, while other paleomagnetic analyses report faster swings (e.g., Nature Communications, 2024). The sea-level method has strengths — a largely independent signal and explicit spatial tests — but it also depends on the quality of palaeogeographic and sea-level reconstructions and the 10-million-year temporal resolution.
Conclusion: Domeier et al.'s sea-level analysis adds an important independent line of evidence that Earth's solid exterior may have reoriented rapidly at least twice during the Mesozoic (around 150–140 Ma and 100–90 Ma). The results sharpen debate about TPW's pace and its potential impacts on past climates and ecosystems. Full data and methods are available in Science (2026) under Domeier et al.
Figure credits: Mathew Domeier et al., Science (2026). Diagrams show the expected four-lobed TPW flooding pattern and representative TPW reconstructions. Individual palaeogeographic maps and statistical models are described in the paper.