Global Military Spending Hit $2.88 Trillion in 2025. Military outlays rose 2.9% year-on-year to about $350 per person. The United States remains the dominant spender ($954bn), and five countries account for 58% of global defence spending. Arms exports are concentrated among a few states and large contractors, while rising defence budgets and new technologies (AI, drones, cyber) are reshaping modern militaries and prompting fiscal trade-offs with healthcare and education.
Five Charts That Reveal The Surge In Global Militarisation — $2.88 Trillion Spent in 2025
(Al Jazeera)
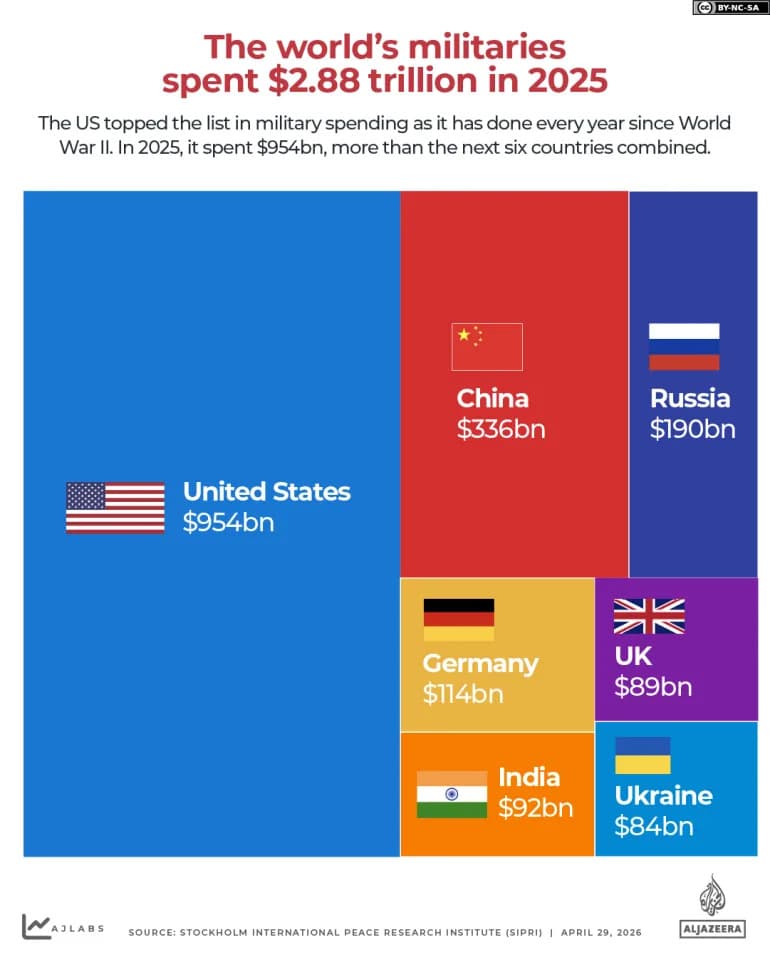
The world’s militaries spent an estimated $2.88 trillion in 2025, a 2.9% increase from the previous year, according to the Stockholm International Peace Research Institute (SIPRI). That sum equals roughly $350 of military spending for every person on Earth. This visual explainer breaks down who spends the most, which countries export the most weapons, how defence budgets compare with public services, and how technology is reshaping modern militaries.
(Al Jazeera)
Global Total and Top Spenders
In 2025 the five largest military spenders were the United States ($954bn), China ($336bn), Russia ($190bn), Germany ($114bn) and India ($92bn). Together they accounted for about 58% of global military expenditure. The US alone spends more on defence than the next six countries combined and has invested at least $53.5 trillion in its armed forces since 1949 — roughly 51.5% of global spending over that period.
(Al Jazeera)
Long-Term Trends
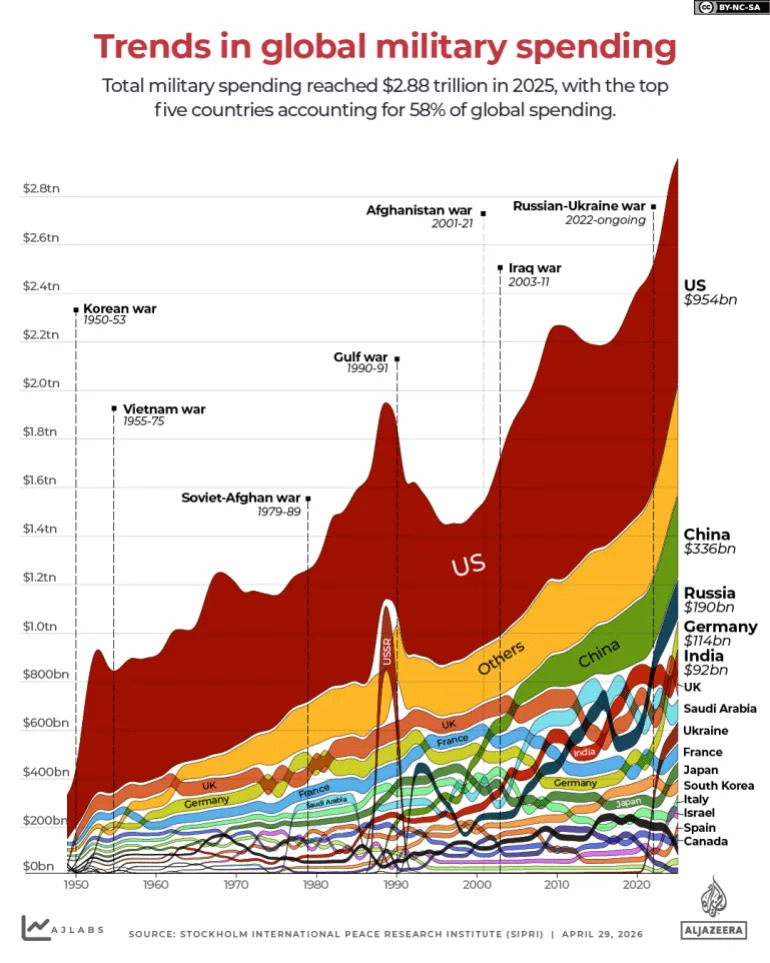
Military spending historically rises during major conflicts and eases during more peaceful periods. After World War II, global defence outlays climbed from $284bn in 1950 to $788bn by 1953 (driven in part by the Korean War). The Vietnam era and Cold War arms race pushed spending above $1 trillion in the late 1960s, peaking around $1.7 trillion in 1988. After the Cold War it fell to about $1.4 trillion by 1991, then rose again after the 9/11 attacks and subsequent wars in Afghanistan and Iraq. The 2014 annexation of Crimea marked another inflection point; since 2016 NATO members renewed focus on defence spending and Europe’s defence budgets rose markedly, with Eastern Europe increasing by about 173%.
(Al Jazeera)
Per-Capita Patterns and Fastest Growth
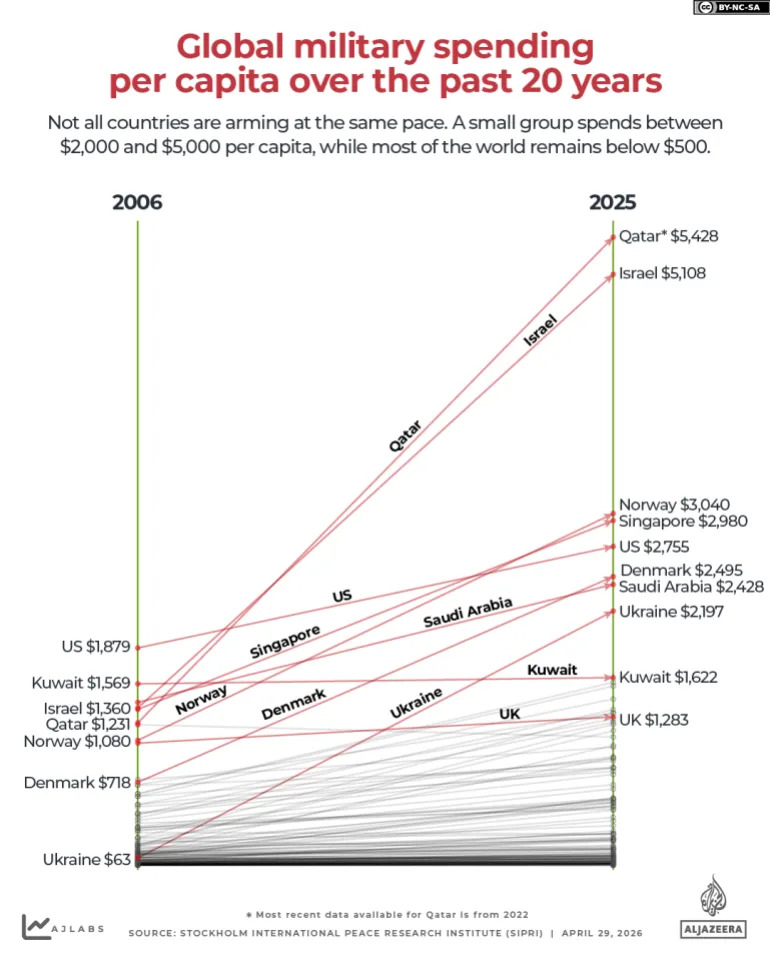
Per-capita military spending varies dramatically. A small group of countries now spends between $2,000 and $5,000 per person; most countries remain in the $100–$500 band. Qatar tops the per-capita list in recent decades, rising from $1,231 in 2006 to $5,428 by 2022 (a 340% increase). Israel and Norway have also seen substantial per-capita increases. By percentage growth, Ukraine recorded the largest jump — from $63 per person in 2006 to $2,197 in 2025 — reflecting the impact of large-scale conflict.
Arms Trade and Defence Contractors
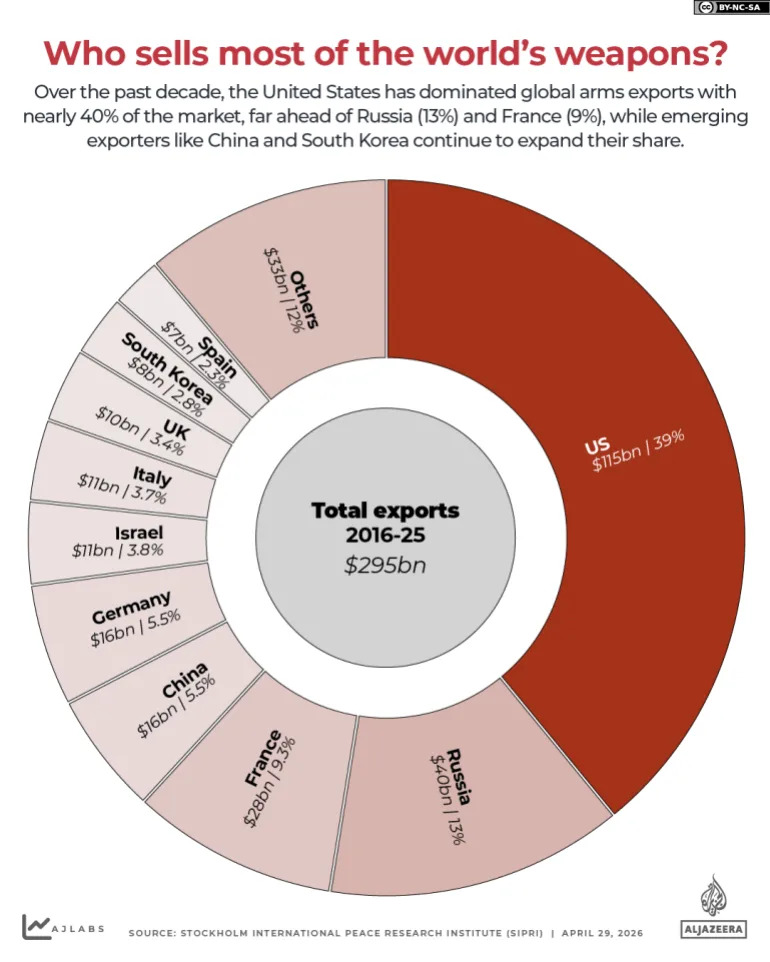
The global arms trade remains concentrated among a few exporters. Between 2016 and 2025 roughly $295bn worth of weapons were sold. The United States accounted for about 39% of exports (~$115bn), followed by Russia (13%, ~$40bn), France (9.3%, ~$28bn), China (5.5%, ~$16bn) and Germany (5.5%, ~$16bn).
US defence contracting is significant: between 2020 and 2024 private firms received about $2.4 trillion in Pentagon contracts, more than half of the department’s discretionary spending. Around a third of that amount (~$771bn) went to five major contractors: Lockheed Martin, RTX, Boeing, General Dynamics and Northrop Grumman.
Defence Versus Public Services
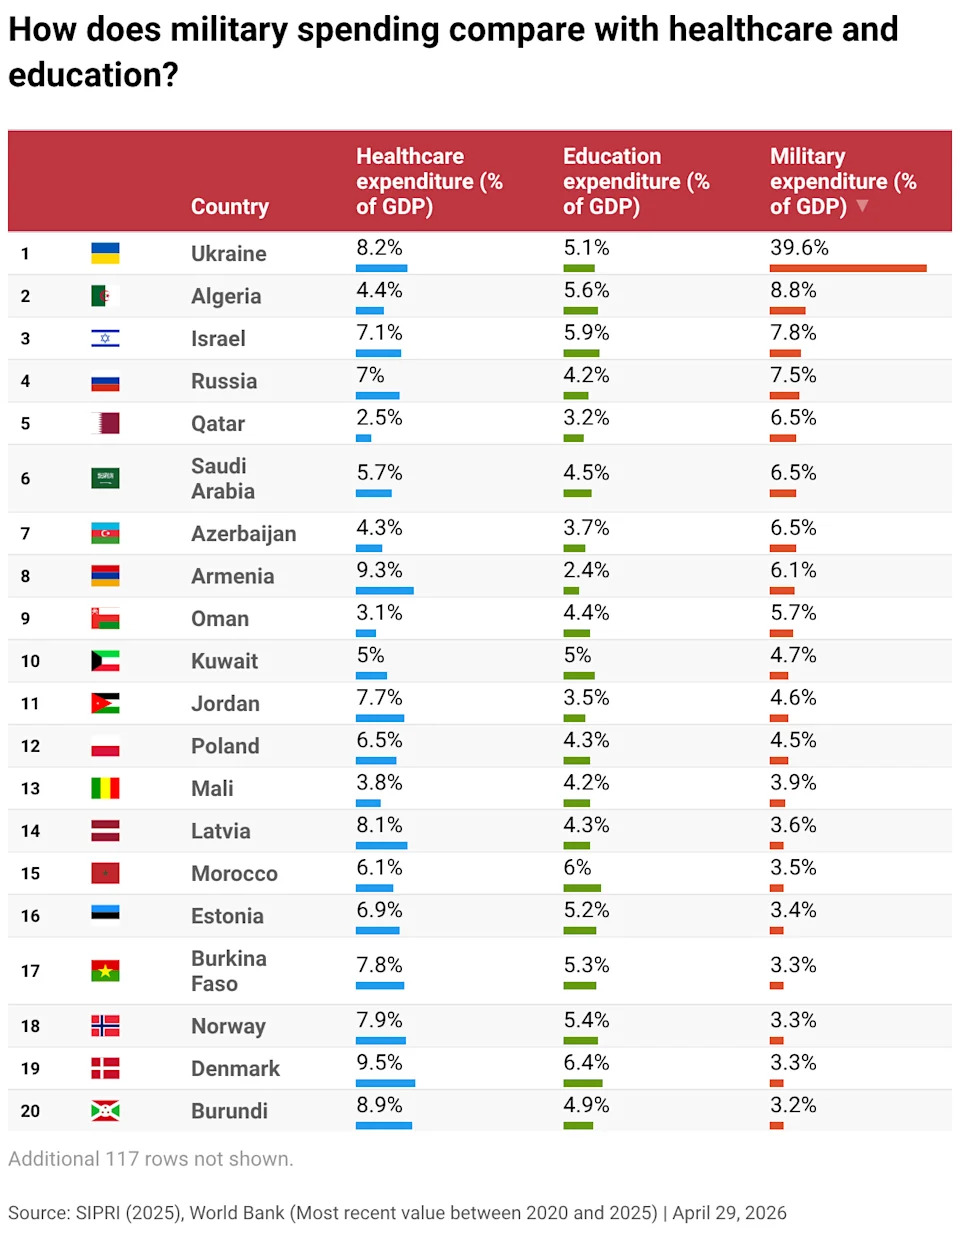
Higher defence spending can crowd out other public priorities unless governments expand revenues or reallocate budgets. In a cross-country review of 137 states, 114 countries spent the most (as a share of GDP) on healthcare, 14 prioritized education, and 9 spent more on the military than on the other two sectors.
Technology and the Changing Face of Defence
Modern militaries increasingly blend traditional capabilities with advanced technology: artificial intelligence, autonomous systems, cyber tools, precision-guided munitions and drones. Governments are integrating commercially developed software and AI into defence systems. For example, in the summer of last year the US Department of Defense awarded contracts worth about $200m each to OpenAI, xAI and Anthropic to explore generative AI applications. Private-sector platforms, including AI-assisted analytics and targeting tools, have been reported as used in recent conflicts according to media and NGO reporting.
What This Means
The 2025 peak in global military spending signals intensified geopolitical competition, growing defence-industrial ties, and accelerating technological change. These trends carry fiscal trade-offs for public services and raise important questions about governance, transparency, and the ethical use of emerging military technologies.
Note: All figures are drawn from SIPRI and cited analyses. Percentages and dollar amounts are rounded to the nearest meaningful figure for clarity.
Help us improve.