A WalletHub analysis ranked all 50 U.S. states by a composite diversity score that includes race, income, education, language, birthplace, occupation, household makeup, religion and politics. California ranks first with a score of 70.85, while West Virginia ranks last at 60.14. The Census Bureau expects the U.S. to lack a single racial or ethnic majority by 2060, and diversity between individuals rose notably between 2010 and 2020.
Which U.S. States Are Most — and Least — Diverse? WalletHub Ranks All 50
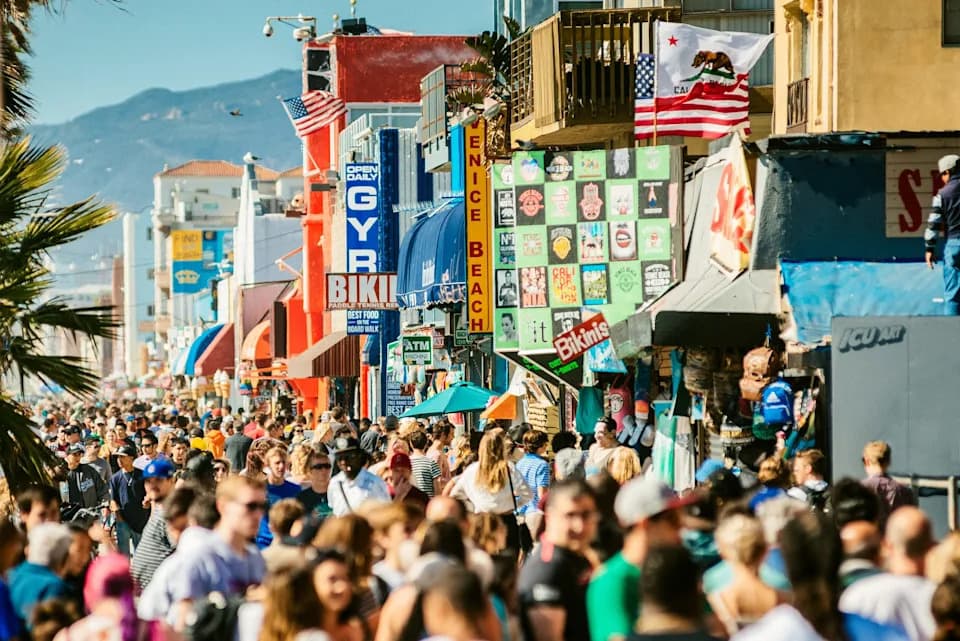
Crowded Venice Beach Broadwalk in Los Angeles. California.
A new WalletHub analysis ranks all 50 U.S. states from most to least diverse using a broad set of indicators that go beyond race and ethnicity. The study combines measures of cultural, socioeconomic and demographic diversity — including income, education, language, birthplace, occupation, household composition, religion and political views — to produce a composite diversity score for each state.
Key Takeaways
California tops the list with a diversity score of 70.85, while West Virginia ranks last at 60.14. Texas is a close second with a score of 70.50. The Census Bureau projects that the U.S. will no longer have a single racial or ethnic majority by 2060; between the 2010 and 2020 censuses, the chance that two randomly selected Americans would belong to different racial or ethnic groups rose from 54.9% to 61.1%.
How WalletHub Measured Diversity
WalletHub’s ranking extends beyond race and ethnicity to capture multiple dimensions of variation within states. Categories included:
- Race and ethnicity
- Income and socioeconomic indicators
- Educational attainment
- Languages spoken and birthplace
- Occupation and industry mix
- Household composition and family structure
- Religion and political views
Highlights
California ranked first overall and led in cultural and linguistic diversity; about 56% of residents speak only English at home, nearly 28% speak Spanish, and roughly 10% speak Asian or Pacific Islander languages. Texas ranked second, leading the nation in industry diversity and having more than 35% of residents speaking a language other than English at home. New Mexico, Florida and Nevada round out the top five, with Nevada noted for exceptionally high household diversity. At the bottom, West Virginia placed 50th overall and ranked lowest in both socioeconomic and cultural diversity as well as educational-attainment diversity.
Full Ranking (Most to Least Diverse)
- California
- Texas
- New Mexico
- Florida
- Nevada
- New York
- New Jersey
- Maryland
- Hawaii
- Arizona
- Georgia
- Illinois
- Virginia
- North Carolina
- Connecticut
- Washington
- Alaska
- Delaware
- Oklahoma
- Rhode Island
- Massachusetts
- South Carolina
- Colorado
- Louisiana
- Tennessee
- Arkansas
- Kansas
- Alabama
- Oregon
- Nebraska
- Pennsylvania
- Minnesota
- Mississippi
- Idaho
- Missouri
- Indiana (Tie)
- Ohio (Tie)
- South Dakota
- Michigan
- Wisconsin
- North Dakota
- Utah
- Iowa
- Wyoming
- Kentucky
- Montana
- Vermont
- New Hampshire
- Maine
- West Virginia
Note: Scores cited are from WalletHub’s composite index. The rankings show that diversity can take many forms — from language and birthplace to industry mix and household types — and that states with similar racial profiles can differ widely on other diversity measures.
WalletHub analyst Chip Lupo said states can be diverse in ways that are not always immediately apparent, including differences in residents' ages, birthplaces, languages, jobs and family structures.
Original reporting appeared in USA TODAY; this summary is an edited and consolidated version of that coverage and the WalletHub analysis.
Help us improve.