On July 29, 2025, a magnitude 8.8 earthquake off Kamchatka generated a tsunami that was imaged in unprecedented detail by NASA/CNES's SWOT satellite. SWOT passed over the open ocean about 70 minutes after the quake and recorded both the leading wave and trailing dispersive waves roughly 375 miles (600 km) from the epicenter. Standard long-wave models could not reproduce those dispersive features, but a Boussinesq-type model did, allowing researchers to locate tsunamigenesis to within about six miles (10 km) of the trench. These two-dimensional observations promise improved tsunami forecasting when combined with existing sensor networks.
Satellite Sees a Tsunami Being Born: SWOT Captures High‑Resolution Wave Signatures From the Kamchatka Quake
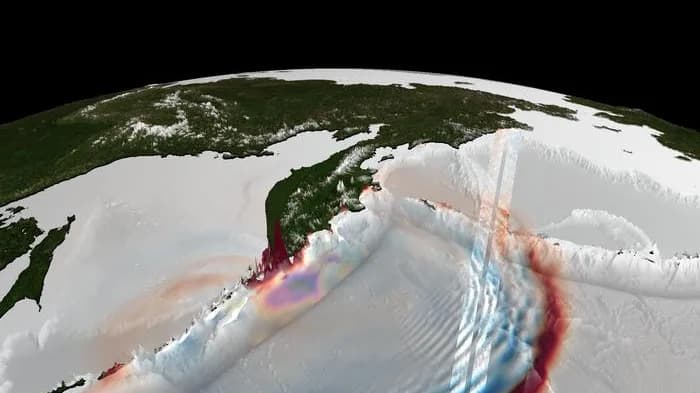
About 1 hour after the earthquake, SWOT captured the offshore tsunami wave field near Kamchatka shown as two red–blue measurement swaths. These data constrained the inferred initial tsunami sea-surface elevation (yellow–purple pattern) and enabled forward simulations that reproduce the surrounding (red–blue) tsunami wave field in agreement with the SWOT observations. | Credit: Bjarke Nilsson
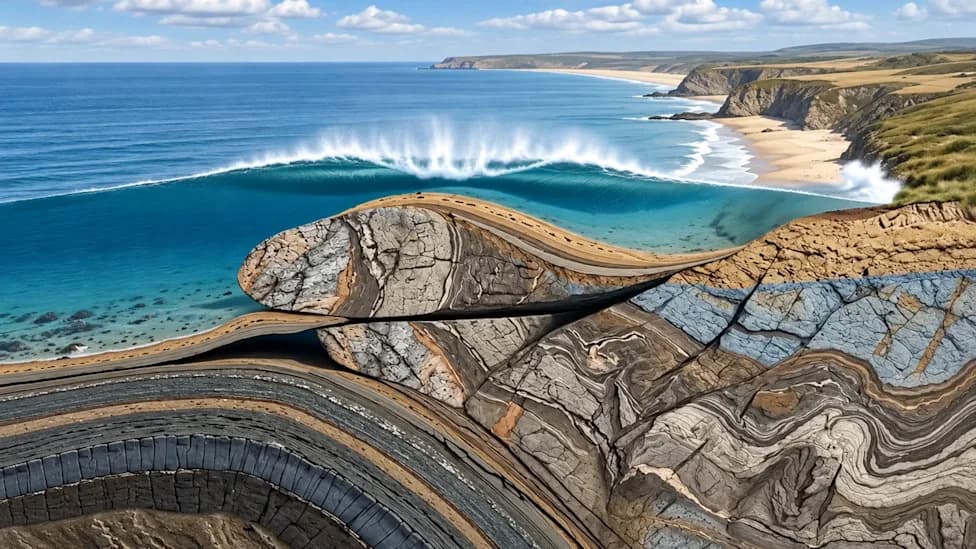
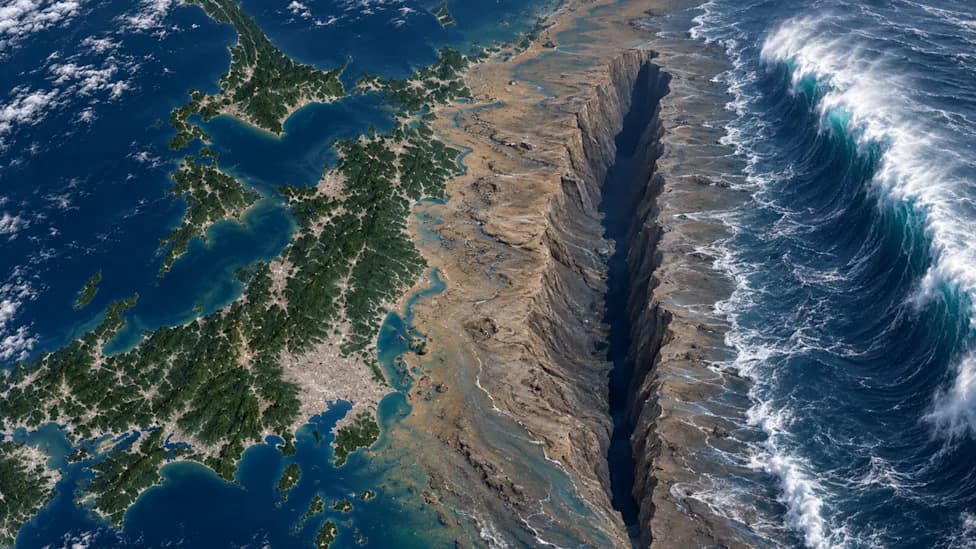
Late on July 29, 2025, a magnitude 8.8 earthquake off Russia's Kamchatka Peninsula ruptured the Earth's crust, displacing the seafloor and triggering a powerful tsunami. Waves raced across the Pacific at jet-like speeds and later surged onto coasts with heights exceeding 55 feet (17 meters).
Until now, scientists understood the broad chain of events — earthquake, seabed displacement, tsunami — but lacked detailed views of how tsunamis form in the near-trench source region. Sparse in-situ sensors near subduction trenches make it difficult to observe the two-dimensional structure of a newly formed tsunami at its origin.
How a Weather/Water Satellite Captured the Event
Instead of relying solely on purpose-built tsunami detectors, researchers used an existing ocean mission: NASA and CNES's Surface Water and Ocean Topography (SWOT) satellite. Although SWOT was designed to study global water levels and ocean circulation, its wide-swath, two-dimensional imaging and centimeter-level precision proved ideal for capturing tsunami surface signatures.
Approximately 70 minutes after the earthquake, SWOT passed about 375 miles (600 km) from the epicenter and recorded high-resolution images of the tsunami's leading wave and a train of smaller, trailing waves.
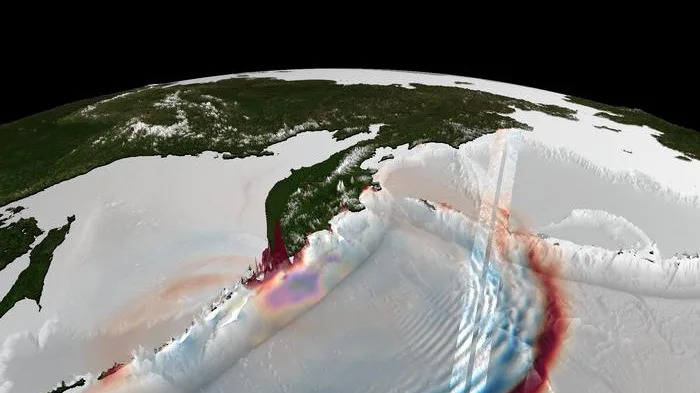
A full version of the image captured by the satellite of tsunamigenesis. | Credit: Bjarke Nilsson
What the Satellite Revealed
SWOT's images showed not only the main tsunami crest but also dispersive waves — shorter, higher-frequency waveforms that spread out from the source. These dispersive features are largely invisible to point sensors such as DART buoys, which measure pressure at single locations on the seafloor and cannot capture the tsunami's full 2D structure.
“With that 2D image, you are able to characterize very well what happened with the tsunami's leading wave and the trailing waves,” said Ignacio Sepúlveda, lead author and director of the SDSU Coastal Engineering Lab.
When Sepúlveda's team tried to reproduce the event using the commonly used long-wave tsunami model, the simulation failed to match SWOT's observations. The difference came from dispersive behavior: long-wave models neglect dispersion, while a Boussinesq-type model can represent it. Using the Boussinesq model, the researchers reproduced the satellite-observed wave train and identified a key result: the dispersive waves carry diagnostic information about where the tsunami started.
Pinpointing Tsunamigenesis
By matching model behavior to SWOT's two-dimensional imagery, the team localized tsunamigenesis to within roughly six miles (10 km) of the trench — the closest source-level identification reported to date. This is the first time high-resolution, two-dimensional ocean-surface observations have been directly linked to the earthquake processes that generated a tsunami in the open ocean.
Why This Matters
Combining satellite observations like SWOT's with traditional tools such as DART buoys can significantly improve tsunami modeling and forecasting. Better models that incorporate near-trench dynamics and dispersive wave behavior should provide more accurate predictions of wave height, arrival times, and coastal impact. In practice, that means faster, more precise warnings and more effective evacuations — potentially saving lives when the next major tsunami strikes.
Bottom line: An existing satellite mission captured the birth of a tsunami in unprecedented detail, revealing dispersive wave signatures that let scientists pinpoint the source and refine models used for forecasting and warnings.
Help us improve.