New England has reached 500 "duck curve" days as rooftop solar reduces midday grid demand so much that daytime consumption can dip below overnight levels. The 500th day was recorded on Sept. 21, 2026, according to ISO New England. The trend has accelerated since the first duck curve in April 2018 and is reshaping reliability, pricing and the need for batteries and flexible resources.
New England Records 500 'Duck Curve' Days as Rooftop Solar Slashes Midday Grid Demand
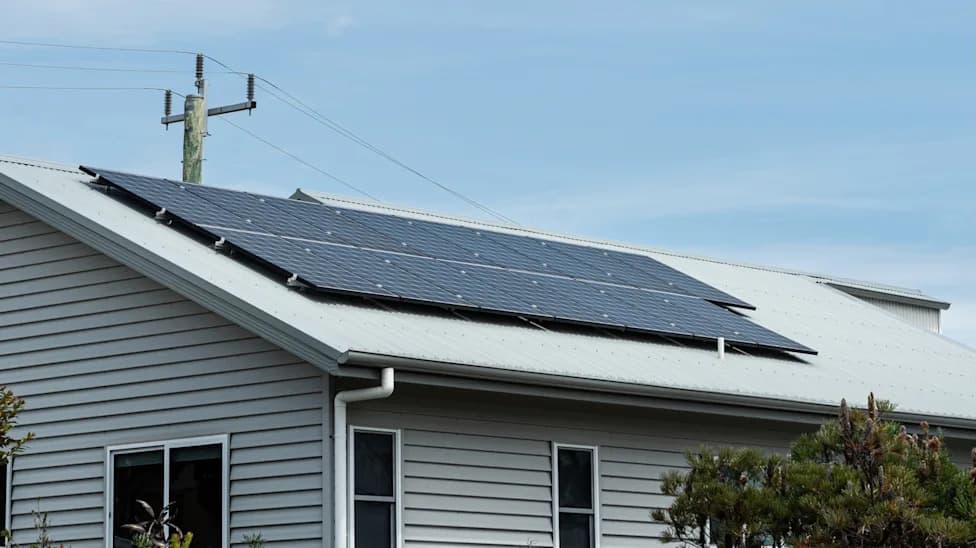
Photo Credit: iStock
Rooftop solar is reshaping New England's electric grid: the region has now recorded 500 "duck curve" days, a milestone that reflects how daytime solar generation can cut midday grid demand so sharply that consumption occasionally falls below overnight levels.
The milestone underscores that small-scale solar on homes and businesses is no longer marginal. Behind-the-meter systems are changing when the grid is busiest, how electricity is priced, and how operators plan for reliability.
ISO New England reported that the 500th duck curve day occurred on Sept. 21, 2026 — the 107th such day in 2026. The pattern has accelerated: after the first duck curve on April 21, 2018, it took nearly five years to hit 100 days. The next 100 came in about 13 months, and the climb from 400 to 500 took just 221 days.
"We're seeing more behind-the-meter solar every year, and we expect that trend to continue," said Mike Knowland, manager of Forecast & Scheduling at ISO New England. He added that the 500th duck curve could have come earlier if the region had seen fewer cloudy days this year.
Duck curves occur when rooftop solar supplies enough midday power to reduce net system demand but cannot meet evening or overnight needs. While the phenomenon was once most common on clear spring weekends, duck curves can now appear in any season and on any day with bright skies and modest weather-driven demand.
Grid Impacts
The growing frequency of duck curve days is forcing grid planners and utilities to rethink reliability, price signals and resource planning. Lower midday demand can shift when peak pricing pressure occurs in markets such as Massachusetts, influencing wholesale prices and the economics of storage, demand response and flexible generation.
Record Low Demand
The region's most pronounced duck curve occurred around 2 p.m. on Easter Sunday, April 20, 2025, when system demand dropped to a record-low 5,318 megawatts.
What It Means For Homeowners
For homeowners considering solar, comparison tools can simplify the process. Services like EnergySage let consumers compare local installer bids without immediately sharing contact details, making it easier to evaluate costs, incentives and potential savings. Pairing solar with batteries or efficient heating and cooling (for example, heat pumps or mini-splits) can help capture value from excess midday generation and hedge against evening peaks.
Broader Trends
Related reporting highlights the ripple effects of rooftop solar across New England:
- Rooftop panels helped reduce power costs during heat waves by roughly $130 million and on some days outperformed nuclear generation.
- In Massachusetts, rooftop solar recently supplied nearly a quarter of New England's peak power in some charts.
- A Connecticut solar bill is boosting the economics of home batteries as rooftop incentive programs hit capacity limits.
- On Cape Cod, one homeowner reports that solar paired with mini-split heat pumps could leave his household about 4,100 kWh ahead.
As behind-the-meter solar continues to grow, ISO New England and market participants will likely see more duck curve days — and more pressure to integrate flexible resources, storage and smarter pricing to maintain reliability and value for consumers.
Help us improve.