The viral “potato” image depicts the geoid — a gravity-defined surface — not Earth’s literal shape. Scientists merged more than a billion satellite measurements collected over ~15 years (from GOCE and GRACE) to build a highly precise gravity model. The 3D rendering applies a dramatic vertical exaggeration (commonly cited ~10,000×) to make tiny geoid deviations visible; real differences are typically on the order of tens to a few hundred feet (tens of meters). Precise geoid models are essential for accurate GPS altitudes, tracking sea-level change, and probing Earth’s interior.
NASA’s ‘Potato Earth’ Is a Geoid Visualization — What the Image Really Shows
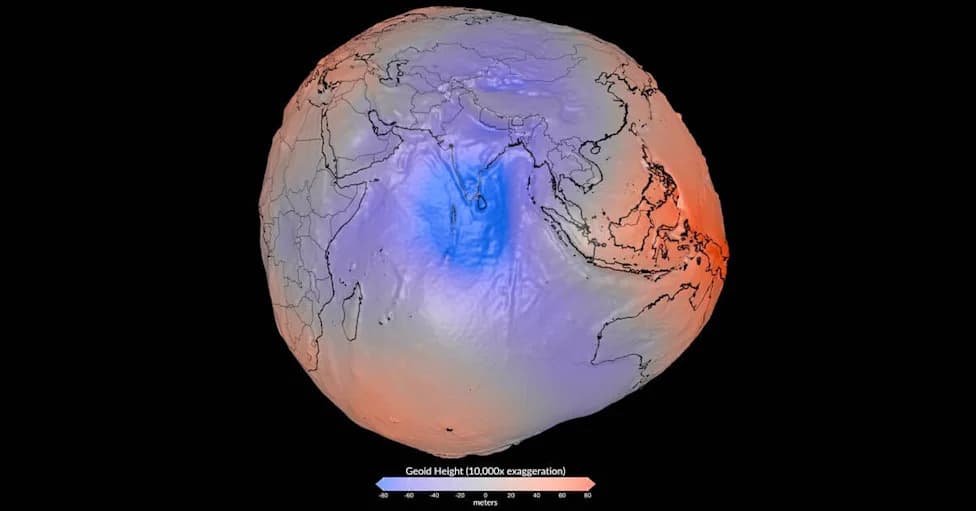
NASA’s geoid model exaggerates Earth's gravity variations by 10,000x, revealing an asymmetrical, potato-like gravitational map. | ©Image Credit: NASA
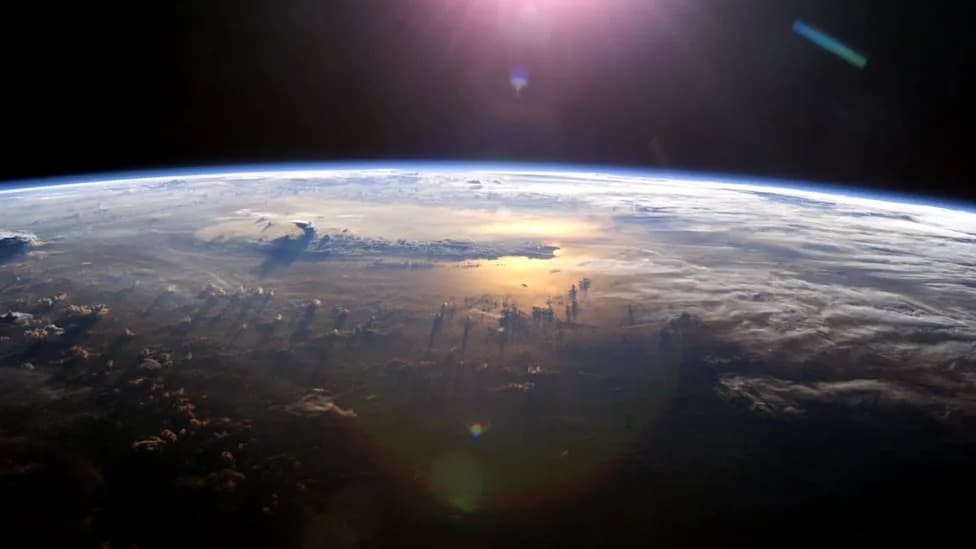
For centuries we’ve pictured Earth as a smooth blue sphere. A striking new visualization — widely shared as a “potato-shaped” Earth — reveals a very different perspective: a map of subtle gravitational highs and lows called the geoid. The image is a scientific rendering, not a photograph of the planet’s literal surface.
What the Image Actually Shows
The geoid is an equipotential surface defined by Earth’s gravity field: it represents how global sea level would lie if it were shaped only by gravity and not by winds, currents or tides. Because gravity varies with the distribution of mass inside Earth, the geoid has small bumps and depressions. Earth itself remains essentially round and slightly flattened at the poles due to rotation — the dramatic “potato” look comes from amplifying those tiny gravity-driven differences in a 3D rendering.
Why the Surface Looks Lumpy
Local variations in density beneath the crust — such as dense rock bodies, mountain roots, or large-scale mantle structures — change the strength of gravity slightly. Regions with more mass create gravitational “highs” (rises in the geoid); regions with less mass create gravitational “lows.” These deviations are subtle in absolute terms but scientifically valuable because they reveal how mass is distributed below the surface.
How the Model Was Built
Researchers combined more than a billion satellite measurements collected over roughly 15 years, merging datasets from missions such as the European Space Agency’s GOCE (Gravity field and steady-state Ocean Circulation Explorer) and NASA’s GRACE (Gravity Recovery and Climate Experiment). Careful processing produced one of the most precise geoid models to date.
- Visual Amplification: The 3D rendering intentionally exaggerates vertical differences (commonly cited as ~10,000×) so tiny gravity variations are visible. The visualization is illustrative, not literal.
- Measured Deviations: The dataset shows a pronounced geoid "high" near Iceland (about +279 ft above the global mean) and a major low south of India (about -348 ft below the mean). These are relative deviations of the geoid surface, representing tens to a few hundred feet (tens of meters) in many places.
Why the Geoid Matters
- Pinpoint Navigation: Accurate geoid models help convert GPS ellipsoidal heights into reliable sea-level–referenced altitudes, improving navigation for aviation, surveying and autonomous systems.
- Tracking Sea-Level Change: A consistent geoid-based "zero" is essential for measuring sea-level rise and how mass redistributions (like melting ice sheets) alter Earth’s gravity and oceans.
- Probing the Interior: Geodesy provides indirect but powerful constraints on tectonic structure, mantle flows and subsurface mass anomalies without drilling.
Bottom line: The “potato Earth” is a visually amplified map of gravity variations — a tool that turns invisible differences in mass into insights about Earth’s interior, ocean heights and stability of navigation systems. It does not indicate any physical collapse or wholesale reshaping of the planet.
Source: Based on reporting from AS.com and public GOCE/GRACE mission results.
Help us improve.