Applications to the top 100 U.S. MBA programs rebounded in the 2025 cycle, rising 3% year‑over‑year and 21.3% versus two cycles ago. Fifty of the top 100 programs reported application growth, but only about one‑third increased enrolled class sizes. Selectivity tightened at 47 schools and yield rose at 31 programs, though many schools still report low yields. Key stories include large jumps at Chicago Booth, Wharton and Northeastern and notable yield shifts across top programs.
Applications Rebound: Acceptance Rates, Yield and Enrollment Trends at the Top 100 U.S. MBA Programs

Stanford Graduate School of Business Application Essay Example
After two relatively slow cycles, applications to U.S. MBA programs rebounded in the 2025 admission cycle. Despite concerns about AI, economic uncertainty and fewer international applicants, candidate interest recovered: aggregate application totals rose year‑over‑year and were markedly higher than two cycles earlier.

Highlights
Poets&Quants’ analysis of U.S. News data for the 2024–2025 admission cycle shows that 50 of the top 100 ranked business schools reported year‑over‑year application growth. Across all 100 programs, 3,686 more applications were submitted in the latest cycle — a 3% increase — and totals were 22,247 higher than two cycles ago (a 21.3% jump).

Notable Program Trends
- Chicago Booth: Applications rose by 705 to 5,876 for the 2025–2026 cycle, after a prior increase of 942. Over three years, Booth’s applications increased by 1,692 (about 40.4%), the largest gain among the M7.
- Wharton: Applications increased by 291 to 7,613, a three‑cycle gain of 1,420 (22.9%).
- Northeastern (D’Amore‑McKim): Reported the single largest year‑over‑year jump, from 439 to 1,254 applications (a 185.7% increase). Northeastern also grew enrollment from 55 to 74 MBAs (a 34.6% rise).
Selectivity, Yield and Enrollment
More applications did not automatically produce larger incoming classes. Enrolled students rose in roughly one‑third of programs — about 32–33 of the top 100 — while enrollment fell at about 50 programs. Admissions behavior varied: 47 schools lowered their acceptance rates in 2025, six held rates steady, and 37 increased acceptance percentages.
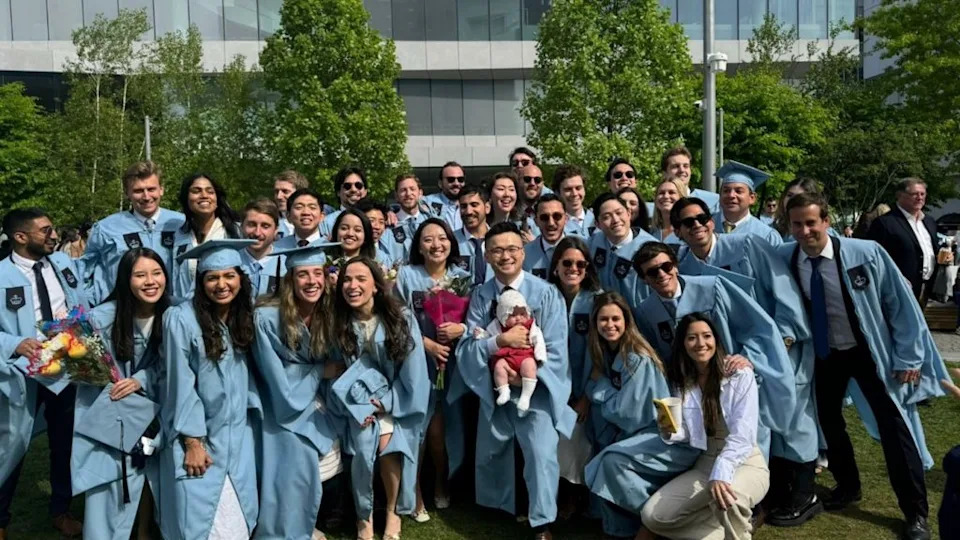
University of Miami (Herbert) posted the largest fall in acceptance rate, from 51.9% in 2024 to 19.5% in 2025 (a 32.4 percentage‑point decline). Miami also reported a 100% yield in 2025, meaning every admitted student who accepted an offer matriculated.
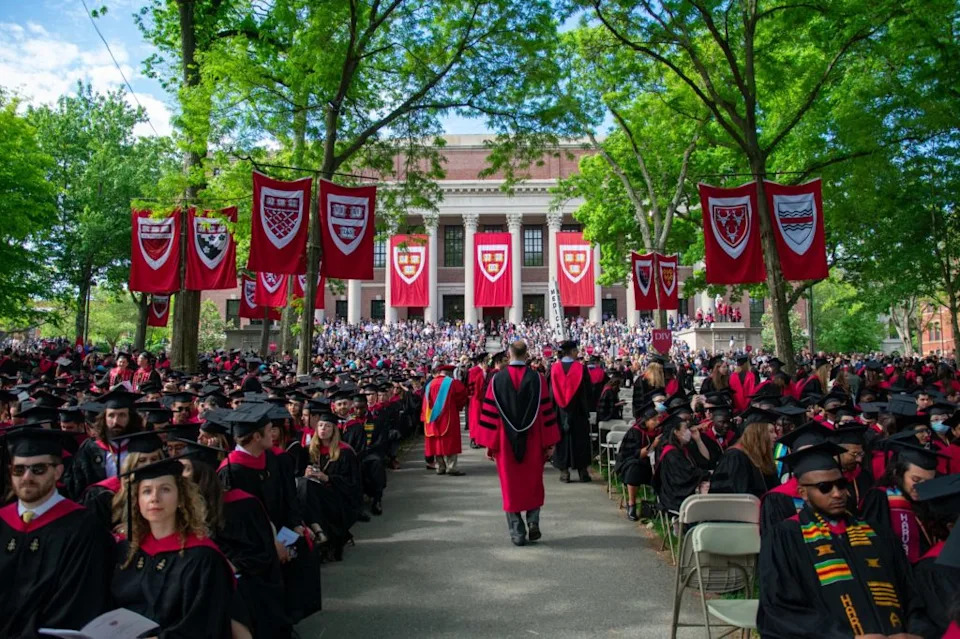
Yield trends: Yield — the share of admitted students who enroll — rose at 31 programs. The biggest jump was at the University of Kansas (up 24.5 percentage points, to 91.2%). Other double‑digit yield increases occurred at Texas Christian (Neeley), Utah (Eccles), Arkansas (Walton), Detroit Mercy and Iowa State.

Among the M7, yield rose at Harvard (+5.0 percentage points), Wharton (+4.9) and Stanford (+2.6). It fell at Northwestern (‑0.8), Columbia (‑7.1), MIT (‑7.7) and Chicago Booth (‑5.2).
Despite gains at some schools, yields remain low at many programs: 25 schools had yields under 30% in 2025 (up from 14 the prior cycle). Nearly half of ranked programs (48 of 100) had yields below 40%, and 63 were under 50%.
Enrollment Decisions
Only a minority of programs expanded cohort sizes. Columbia Business School increased enrollment to 804 (from 760) in 2025, a 44‑student gain and 121 more than in 2023. The University of Miami more than doubled its class (31 to 72). Conversely, 52 schools reduced class size; the largest declines included North Carolina (Kenan‑Flagler) (‑43), Southern California (Marshall) (‑35) and Maryland (Smith) (‑29).
Data Availability
The article’s underlying tables (acceptance rates, yields, applications, admits and enrollment) cover the top 100 programs in the P&Q 2026 ranking and are sourced from U.S. News’ latest MBA dataset. The P&Q tables provide three‑year comparisons (2023–2025) for each metric.
What This Means
Applications have broadly recovered since the trough two cycles ago, but many schools responded by tightening selectivity or holding cohort sizes steady instead of expanding intakes. Yield management and strategic enrollment choices are shaping how increased application volume translates into final class sizes. For applicants, competition at top programs remains strong; for schools, converting interest into enrolled students is increasingly strategic.
Help us improve.