NASA used the ECCO ocean model to create a vivid, Van Gogh–like visualization of subsurface ocean currents, showing near-surface flows in white and deeper currents in blue. The animation highlights how the Coriolis effect and western boundary currents (like the Gulf Stream) transport heat and nutrients, supporting marine life and regulating climate. Scientists warn that freshwater from melting Antarctic ice could alter salinity and disrupt global circulation, raising concerns about the stability of the AMOC.
NASA’s ECCO Visualization Turns Hidden Ocean Currents Into Art — And a Climate Warning
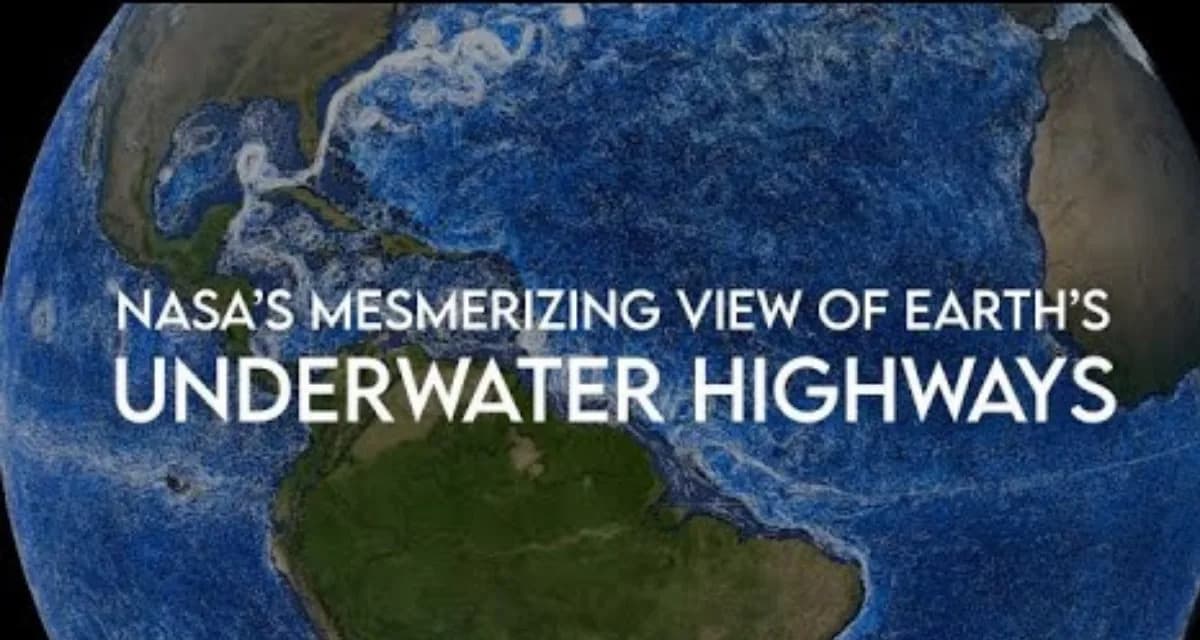
NASA created a visualization of ocean current layers.
Seen from space, Earth looks like a serene blue marble. Zoom in, however, and most of that blue is in constant motion: layered currents beneath the surface that are normally invisible to the eye. NASA has translated those hidden flows into a striking visualization that is both scientifically informative and visually beautiful.
How the Visualization Was Made
Researchers used the Estimating the Circulation and Climate of the Ocean (ECCO) model to generate the animation. Senior research scientist Josh Willis describes what viewers are seeing as white and blue swirls sweep across the globe:
“All of this movement starts with physics. Because the Earth is spinning, the water feels something called the Coriolis effect. This pushes some of the strongest currents, like the Gulf Stream and the East Australian Current, against the east side of the continents. Because these currents wind up on the west side of the ocean basins they sit in, scientists call them western boundary currents. In this visualization, the currents closer to the surface are white, and the deeper currents are blue, almost like you’re seeing those deep currents through the top layer of water.”
What the Animation Shows — And What It Doesn’t
The animation makes it easy to follow large-scale horizontal flows: how currents wrap around basins and carry heat and salt across the planet. But, as Willis notes, it is less effective at revealing vertical motion — the places where water rises (upwelling) or sinks (downwelling).
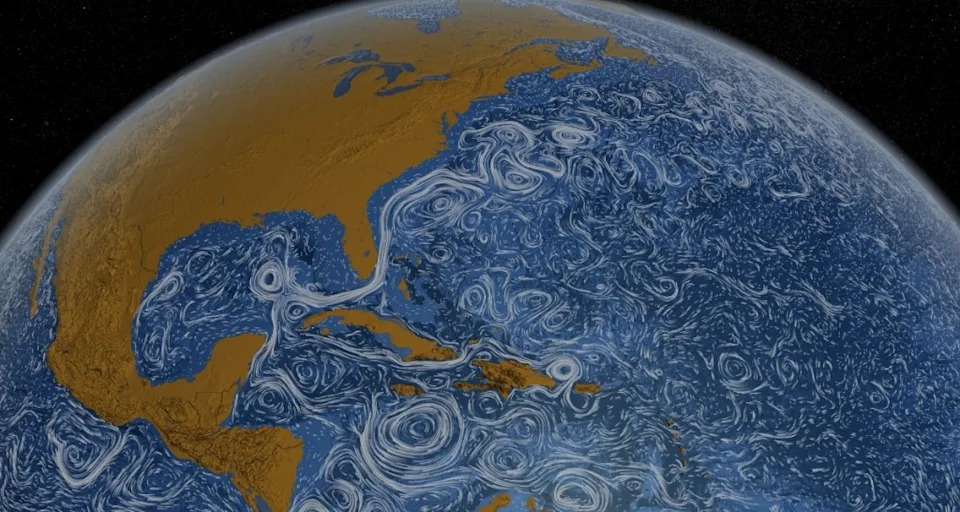
Earth’s ocean currents, visualized by NASA. (Photo credit:NASA/Goddard Space Flight Center Scientific Visualization Studio)
Upwelling is crucial for marine ecosystems. When cold, nutrient-rich deep water rises into sunlit surface layers, it fuels plankton blooms and feeding grounds that support fish and larger marine animals. Beyond ecology, ocean circulation is a central component of global climate: currents move heat and salt in what scientists call the global conveyor belt, moderating temperatures and weather patterns around the world.
Gulf Stream Example
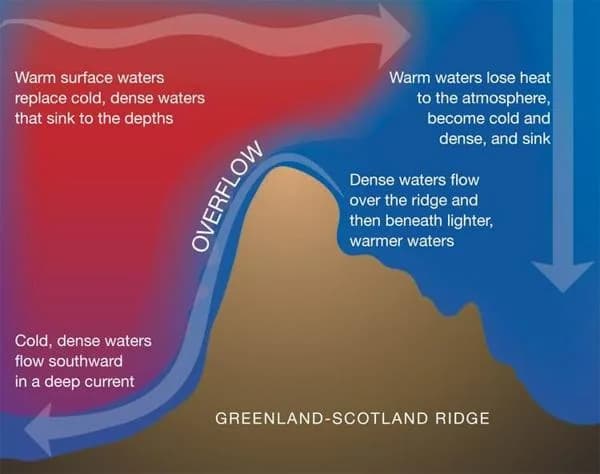
The Gulf Stream illustrates how circulation affects climate. It begins in the tropics where water is warm, carries heat north along the east coast of North America, and acts like a heater for the atmosphere. By the time that flow reaches the North Atlantic near Europe, Iceland and Greenland, the water has cooled and — together with increased salinity in some regions — can sink to great depths.
Salinity and temperature act together: saltier water tends to sink while fresher water tends to rise. These differences help drive downwelling and upwelling that sustain the overturning circulation.
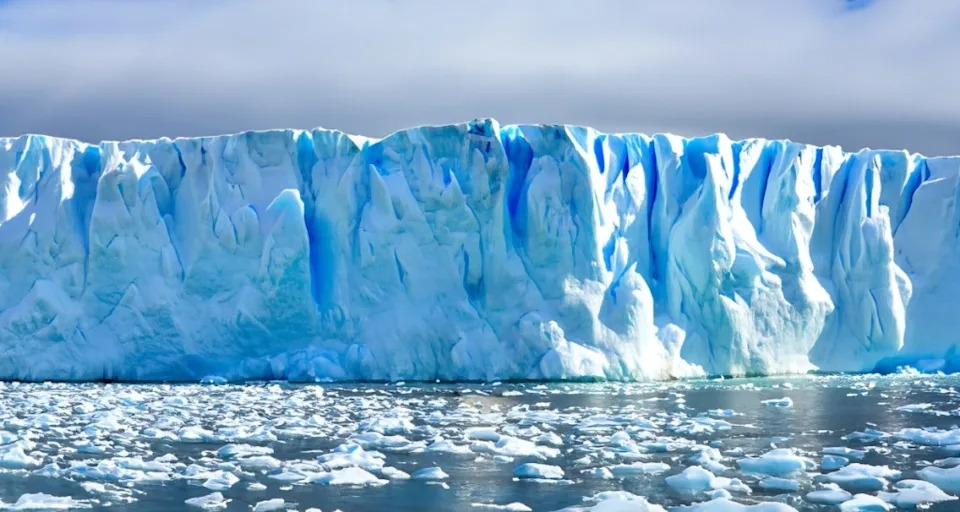
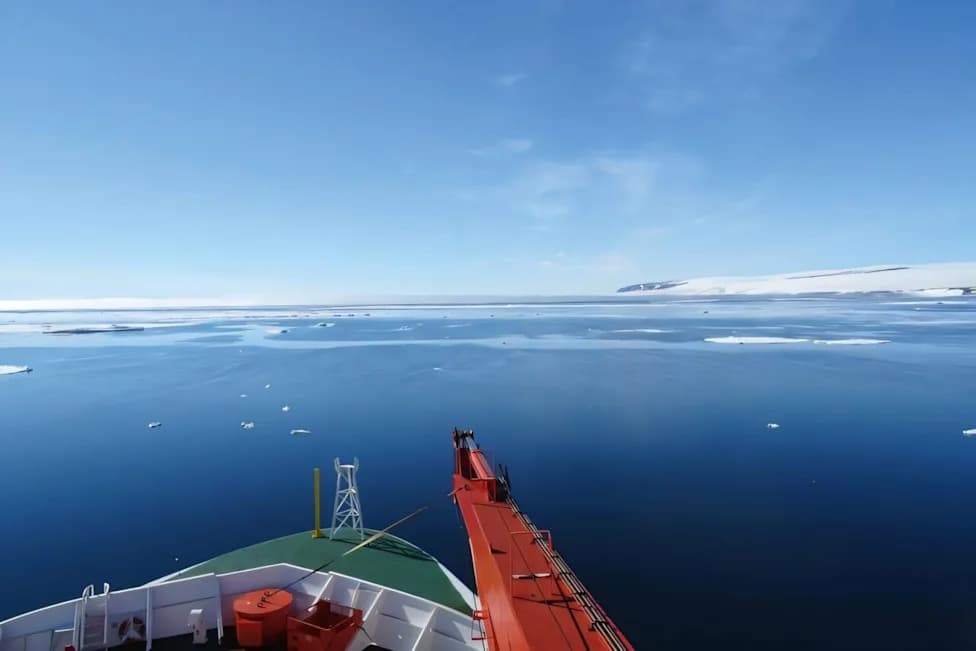
Antarctic ice melts into the Southern Ocean. (Photo credit:Canva)
Why Circulation Stability Matters — And What’s Threatening It
Seeing the oceans as an integrated system raises a worrying question: what if that circulation weakens or collapses? Scientists have long worried about warming-driven changes to ocean currents, especially in the North Atlantic. Recent research has also highlighted risks in the Southern Ocean: as Antarctic ice melts, large inputs of fresher water alter salinity and can disrupt established circulation patterns.
Because the world’s oceans are interconnected, a disturbance in one basin can propagate and affect circulation elsewhere. Of particular concern is the Atlantic Meridional Overturning Circulation (AMOC), the dominant current system in the Atlantic. In November 2025, Iceland declared the risk of an AMOC collapse a national security threat, warning that such an event could trigger large and rapid climate shifts across many regions.
“I have personally researched this for 35 years,” said Stefan Rahmstorf, a physical oceanographer at the Potsdam Institute for Climate Impact Research, in an interview with Yale 360. “For the first 30 years we considered this a low likelihood event — I would have said a 5 percent chance of occurring. It’s more like 50/50 now. I would even say more likely than not.”
Models and projections continue to evolve as new observations are added. No single outcome is guaranteed, but reducing greenhouse gas emissions and limiting warming remain the most direct ways to lower the odds of major circulation disruption.
Why It Matters to Everyone: The ECCO visualization turns complex ocean physics into a clear, artful snapshot of planetary circulation — and a useful reminder that changes beneath the surface can have far-reaching consequences for climate, ecosystems, and human societies.
Help us improve.