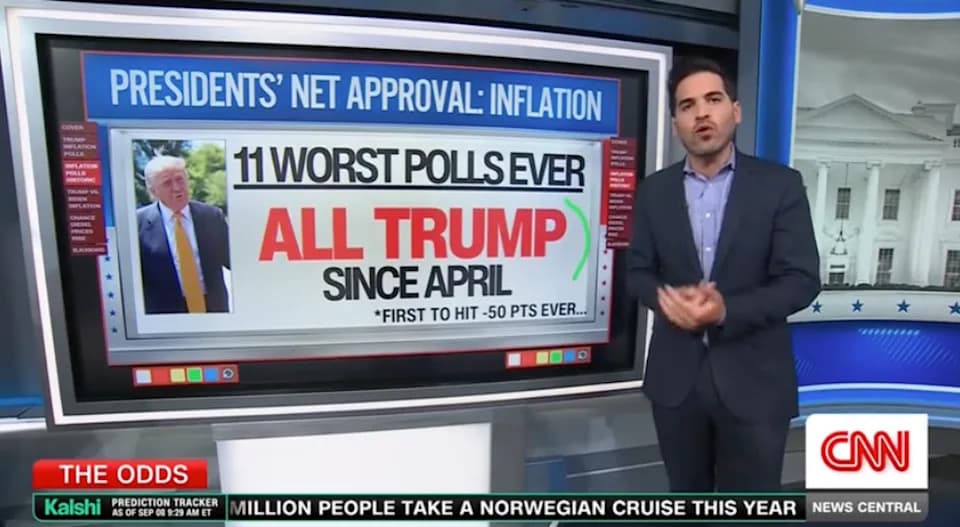
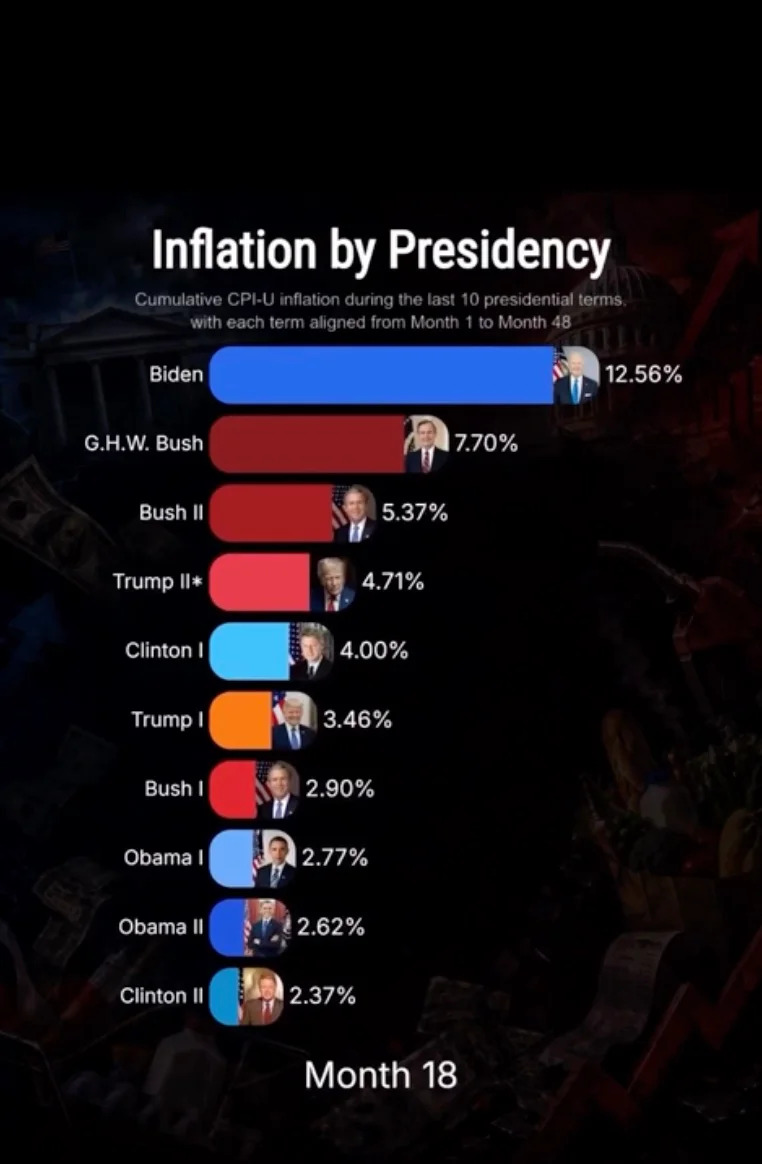
President Trump shared a Truth Social video that shows 4.71% cumulative CPI-U inflation at Month 18 for a hypothetical second term and compares that figure to recent presidents. The animation is misleading because it assumes that inflation will remain unchanged from Month 18 through Month 48. Lara Trump reposted and praised the clip, while CNN analyst Harry Enten said inflation is hurting Trump politically, citing large drops in favorability and a reported -50% approval on inflation.
Trump Posts Misleading Inflation Chart Claiming 4.71% at Month 18 — Graphic Assumes Flat Inflation Through Month 48
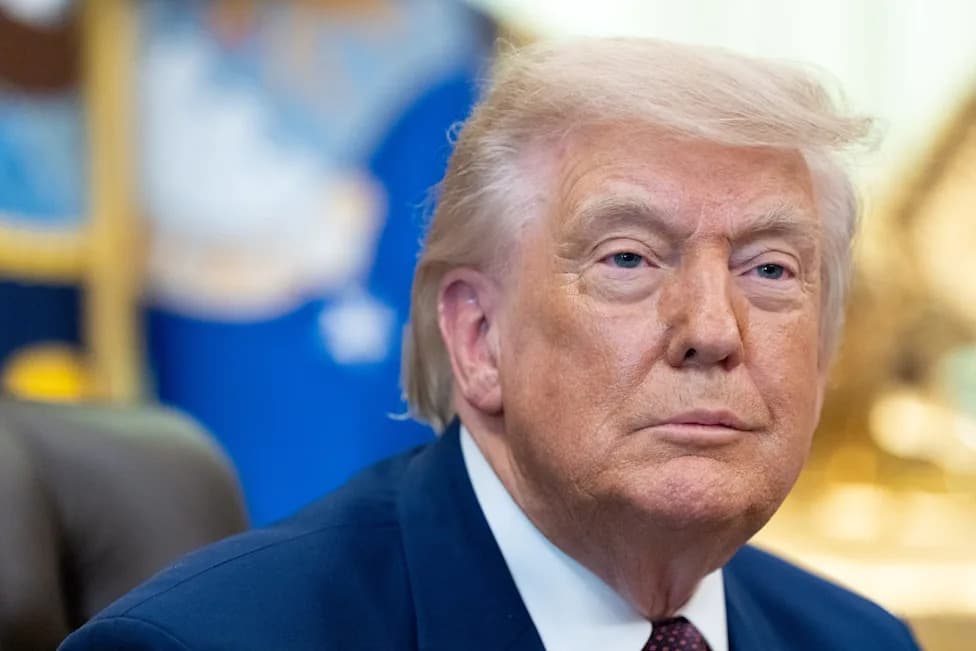
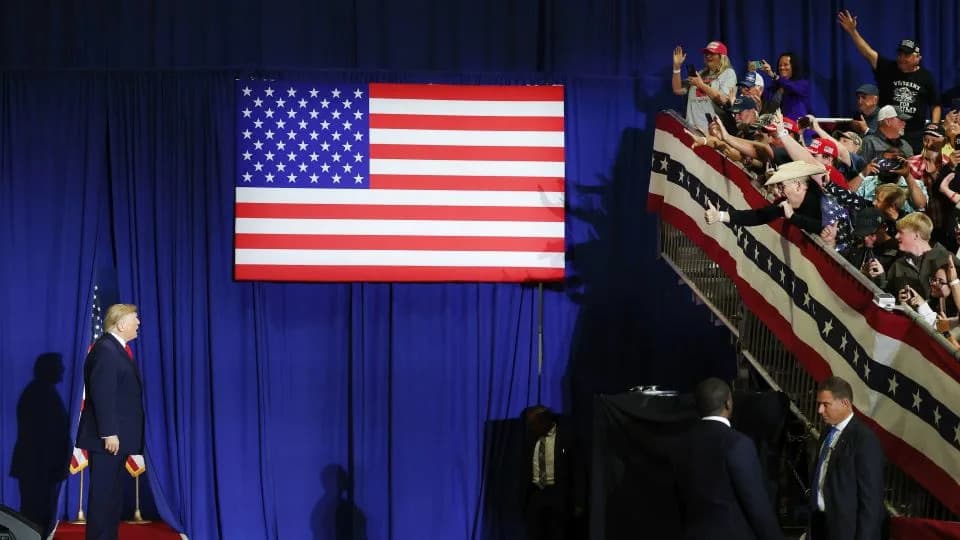
(Photo Credit: Alex Brandon/AP Photo)
President Donald Trump shared a video on Truth Social that presented cumulative inflation for a hypothetical second term labeled "Trump II" and compared it with several recent presidents. The clip highlights a 4.71% cumulative CPI-U inflation figure at Month 18 for "Trump II" and animates rankings through Month 48, ultimately showing Trump near the bottom of the list.
What the Graphic Shows
The short video stacks cumulative inflation curves for multiple modern presidencies — including Joe Biden, George W. Bush and Barack Obama — all beginning from the same baseline and then animating month-by-month. The clip explicitly labels the series as cumulative CPI-U inflation and pauses on the Month 18 data point for "Trump II," which it displays as 4.71%.
Why the Chart Is Misleading
There are two key reasons the presentation misleads viewers:
- It Treats Month 18 as Fixed for Months 19–48. The animation implicitly assumes the 4.71% cumulative inflation at Month 18 will remain unchanged through Month 48 for a hypothetical second term. That is an unproven projection, not an apples-to-apples comparison with completed presidencies.
- Cumulative Vs. Annual Rates And Baseline Choices. The chart uses cumulative CPI-U inflation rather than the more commonly cited annual inflation rate. Starting every presidency from the same baseline also influences how lines climb and rank, which can obscure short-term volatility or later economic changes.
"Wow. Great chart," Lara Trump wrote when she posted the same video on Instagram, adding that the graphic "compares cumulative inflation across the last 10 presidential terms, with every presidency starting from the same baseline." She also quipped that "Trump II is only through Month 18 because, inconveniently, we have not yet developed time travel."
Political Context
The post comes as inflation and the economy are prominent political liabilities. CNN data analyst Harry Enten noted that net favorability on the economy has fallen sharply — reporting a 42-point drop from +9% to -33% — and that Trump has a reported -50% approval rating on handling inflation in a recent CNN poll.
Bottom line: The video highlights a real Month 18 data point, but its presentation implies a future that is assumed rather than demonstrated. Viewers should treat the animated Month 48 comparisons with skepticism because they rely on an assumption that inflation will stay flat for the remainder of the hypothetical term.
Help us improve.