Study links proximity to industry and highways with higher air pollution and asthma across the Philadelphia metro area. An analysis of 766 census tracts in 2025 found the worst asthma rates in several North Philadelphia neighborhoods and one Chester County tract, while greener areas had lower pollutant levels and asthma prevalence. The research implicates decades of zoning, traffic routing and uneven reinvestment — often rooted in historic redlining — and calls for targeted green infrastructure, monitoring and planning reforms.
Study: Philly Neighborhoods Near Industry and Highways Suffer Worst Air and Highest Asthma Rates
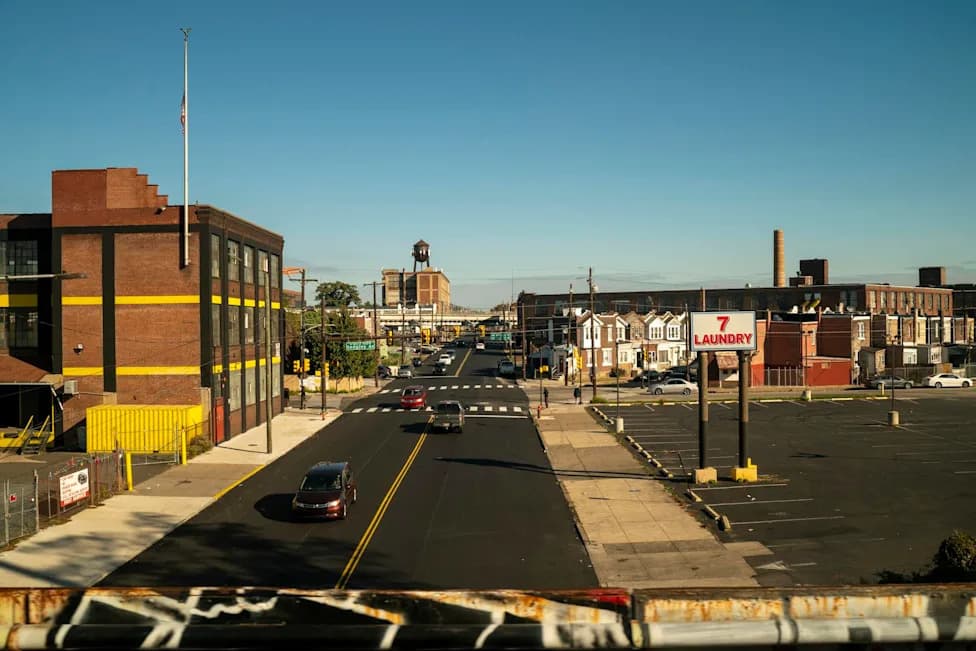
A view from a bridge overlooking the Harrowgate neighborhood of North Philadelphia.Robert Nickelsberg/Getty Images
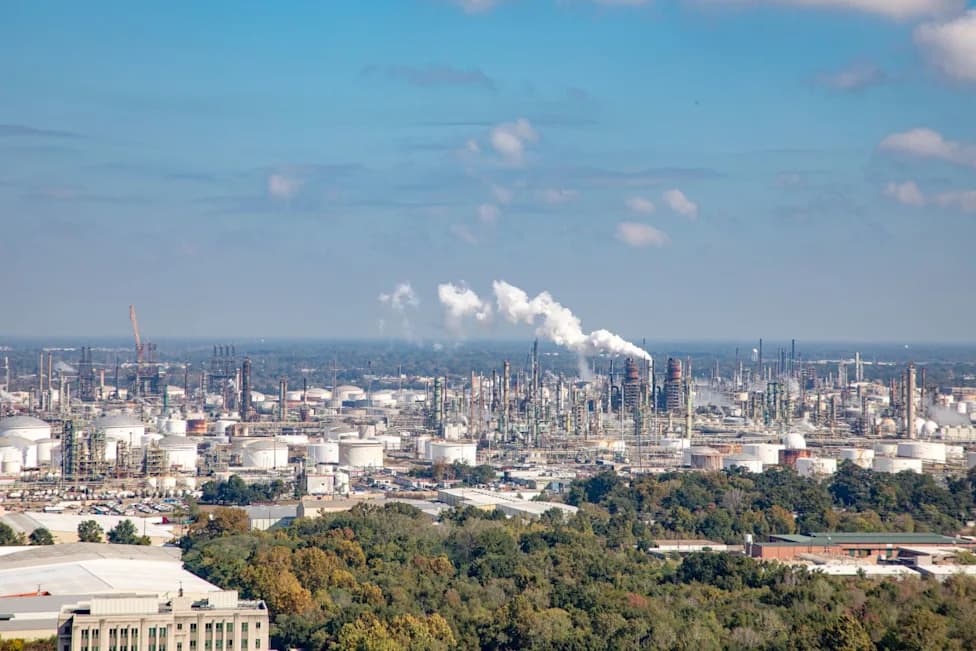
Philadelphia’s poorest air quality falls hardest on neighborhoods near industrial corridors and major highways, driving elevated asthma rates. Residents closest to industrial sites and busy roads — for example, Port Richmond and Bridesburg along I‑95 and communities beside the Delaware River port‑industrial corridor — face higher diesel and NO2 pollution and greater asthma prevalence than those living farther away.
Study Design and Data
We are urban and regional planning professors and a graduate research fellow with expertise in environmental planning, environmental health and climate resilience. In 2025 we analyzed 766 census tracts across nine Pennsylvania and New Jersey counties within the Philadelphia metropolitan region, which contains dense city neighborhoods, older suburbs and lower‑density communities.
To examine connections among land use, pollution and asthma, we combined land‑use and road network data from the Delaware Valley Regional Planning Commission, demographic data from the U.S. Census Bureau, asthma prevalence estimates from the Centers for Disease Control and Prevention, pollution metrics from the U.S. Environmental Protection Agency, and historical redlining maps from the University of Richmond’s Mapping Inequality project.
Key Findings
We ranked tracts by the share of adults diagnosed with asthma. The five tracts with the highest adult asthma prevalence were, in order: Franklinville (North Philadelphia), Stanton (North Philadelphia), Bartram Village (Southwest Philadelphia), Strawberry Mansion (North Philadelphia) and the area around West Chester University (Chester County).
Neighborhoods with more green space tended to have lower levels of diesel particulate matter, nitrogen dioxide and other toxic pollutants, and many of these greener areas also showed lower asthma prevalence.
Greater Philadelphia received straight Fs for air quality in the American Lung Association’s 2026 State of the Air report, ranking 17th worst among more than 200 U.S. metropolitan areas for year‑round particle pollution — a signal that many residents face unhealthy air exposure year‑round.
How Planning Shapes Health
Our results underscore that asthma is not only a medical issue but also an urban planning and policy issue. Zoning that allows industry next to homes, schools and childcare centers places emission sources near residents. Transportation planning that concentrates highways, truck routes and freight corridors in certain neighborhoods increases exposure to diesel particulate matter and nitrogen dioxide. Conversely, parks, street trees and other green buffers help reduce exposure.
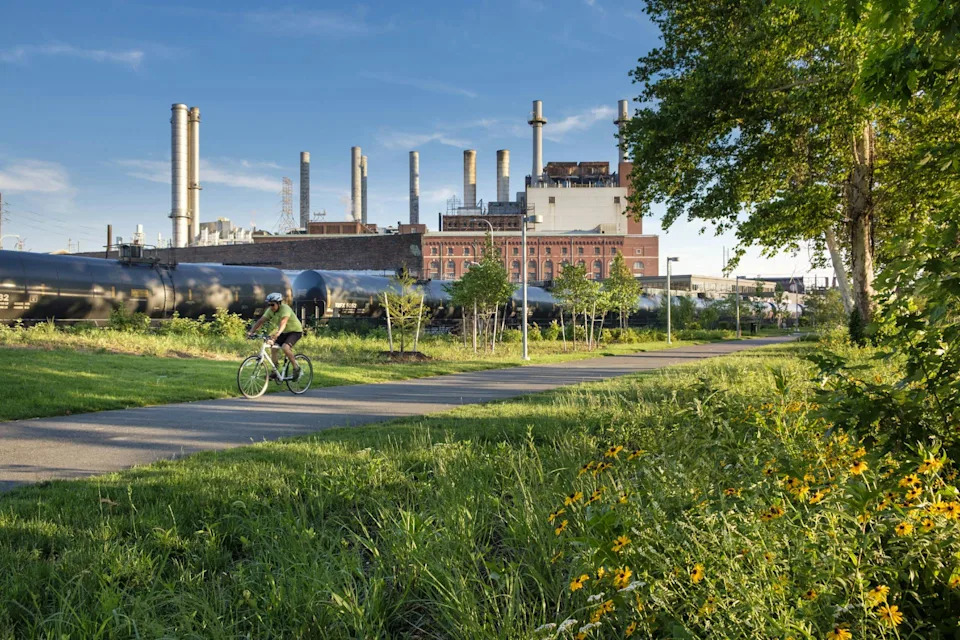
The Schuylkill Banks trail brought more public green space to Grays Ferry in 2025.Jumping Rocks/Universal Images Group via Getty Images
Where industrial activity, heavy traffic and limited green space overlap, residents often face multiple, cumulative environmental risks. Those burdens commonly fall on communities that have experienced long‑term disinvestment — reduced infrastructure spending, fewer business loans and lower property investment — trends often rooted in historical practices such as redlining.
Historical Redlining and Mixed‑Use Areas
Redlining maps were available for four of the nine counties. For comparison, we collapsed the federal Home Owners’ Loan Corporation (HOLC) grades into two groups: "Favorable" ("Best" and "Still Desirable") and "Unfavorable" ("Declining" and "Hazardous"). Contrary to a simple expectation that worse historical grades would always correspond to higher current asthma, the highest asthma prevalence appeared in neighborhoods where "Declining" or "Hazardous" areas covered an intermediate share of the land.
These "in‑between" zones often contain mixed residential, commercial and industrial uses and appear to have undergone continuous change since the 1960s. They may have been especially exposed to later redevelopment, traffic growth, remaining industrial activity and uneven reinvestment — where new projects reached some blocks but not others or brought new burdens like truck traffic alongside investment.
Limitations
Our analysis identifies neighborhoods with concentrated asthma risk but cannot explain any single person’s health. We lacked measures of indoor asthma triggers (mold, pests, ventilation), data on smoking and occupational exposures, information on time spent outside home neighborhoods, and metrics for health care access (insurance coverage and proximity of providers), all of which affect diagnosis and treatment.
We used a cross‑sectional approach and could not track how pollution, land use or demographics changed over decades. Future work should add finer‑scale pollution monitoring and longitudinal land‑use data to clarify timing and causal pathways.
Policy Implications and Next Steps
Local planners, public health officials and policymakers can use these findings to target monitoring, green infrastructure investment (parks, street trees, repurposed vacant lots), stricter land‑use buffers around sensitive sites, truck routing reforms, and improved community health access. More localized studies in mixed‑use and redeveloping neighborhoods such as Grays Ferry and Kensington will help tailor protections and investments.
Authors and Funding
Authors: Qian He (Rowan University), Mahbubur Meenar (Rowan University) and Sean Olcese (Rowan University).
Funding disclosures: Qian He reports funding from the National Science Foundation, NASA, the U.S. Environmental Protection Agency, the New Jersey Department of State Office of Planning Advocacy, and the South Jersey Institute for Population Health. Mahbubur Meenar reports funding from NASA, the EPA, the NSF, the New Jersey Department of State Office of Planning Advocacy, and the South Jersey Institute for Population Health. Sean Olcese reports funding from the NSF and the EPA.
Help us improve.