Prolonged drought and extreme heat have driven an intense 2026 wildfire season. GWIS data show fires burned roughly 433,500 square miles and emitted over 2.3 billion metric tons of carbon through Aug. 1, 2026 — an amount comparable to the EU's annual emissions. Climate Crisis 247 used GWIS figures to rank the top 10 countries by wildfire carbon emissions, led by the Democratic Republic of Congo and followed by Russia and Canada. Wildfire smoke has also released large amounts of PM2.5, posing serious cross-border public-health risks.
The Countries Producing The Most Wildfire Pollution In 2026 — Global Emissions, Health Risks, and the Top 10
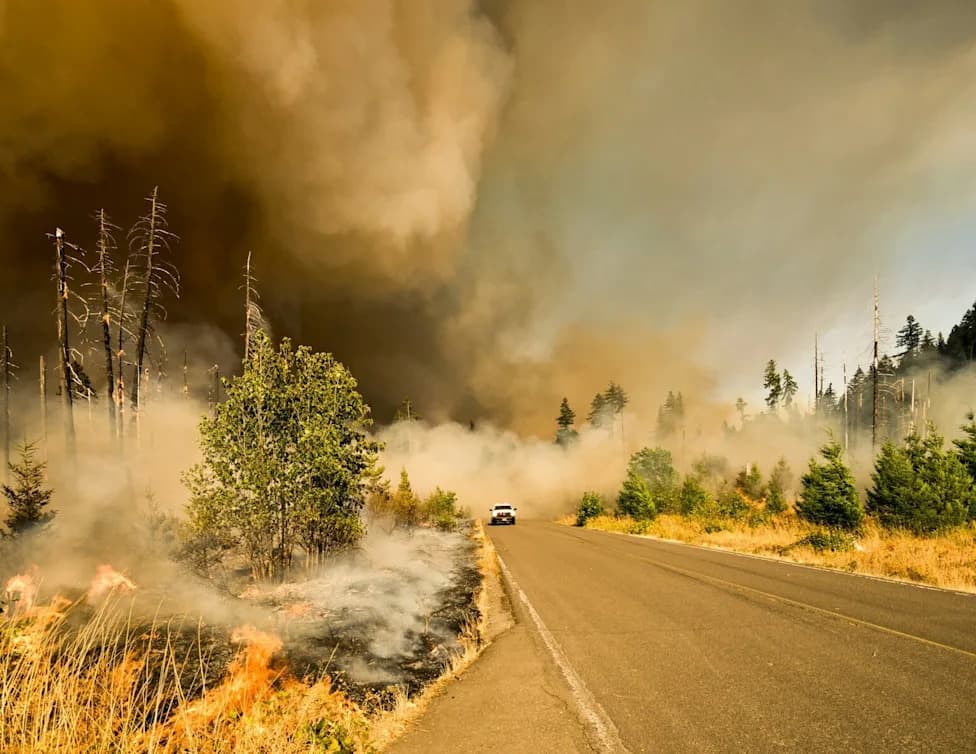
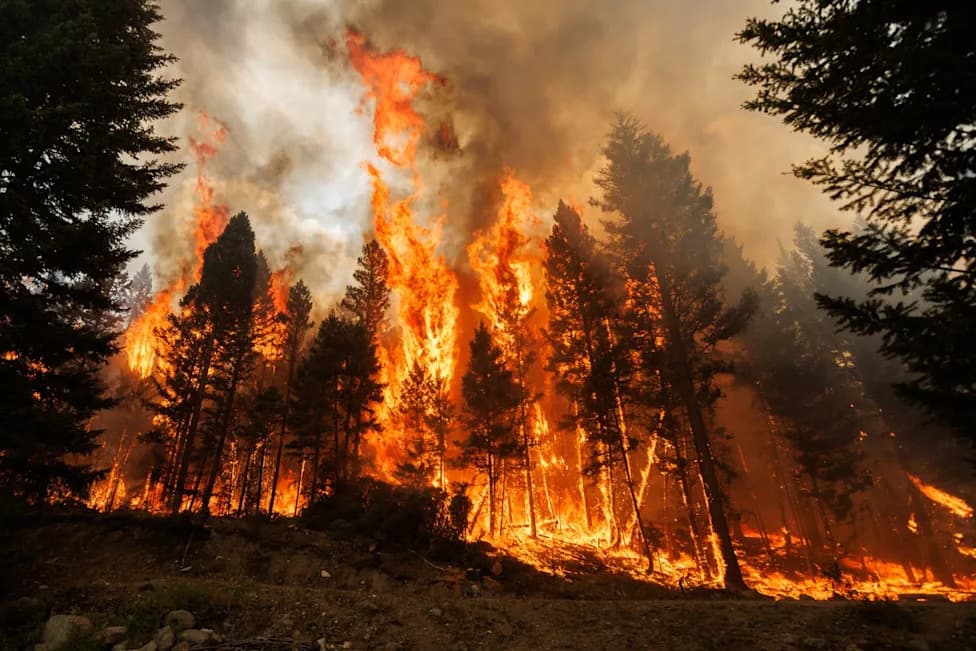
Photo by Marcus Kauffman on Unsplash
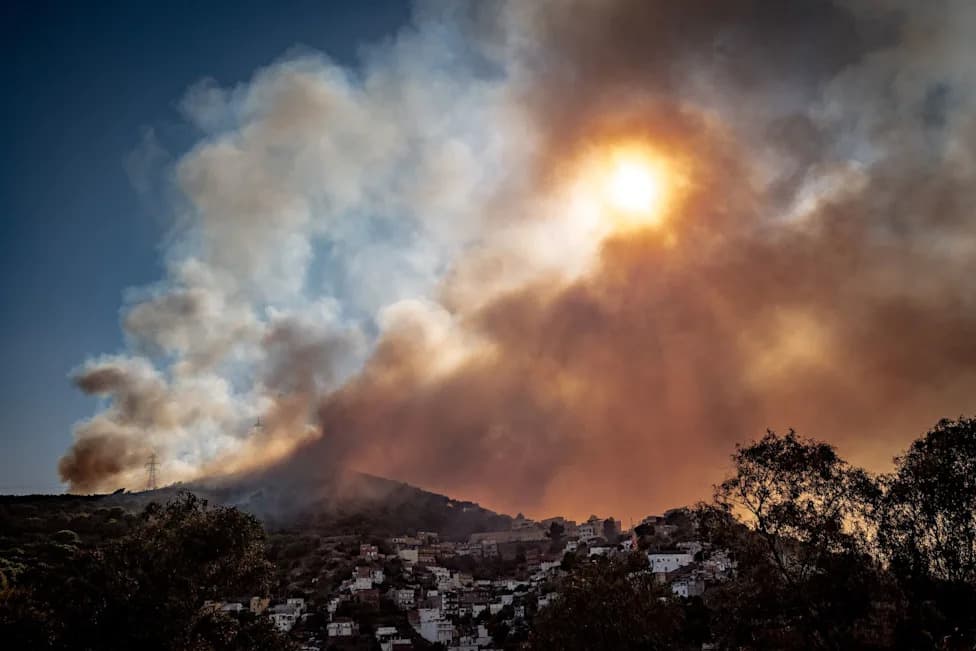
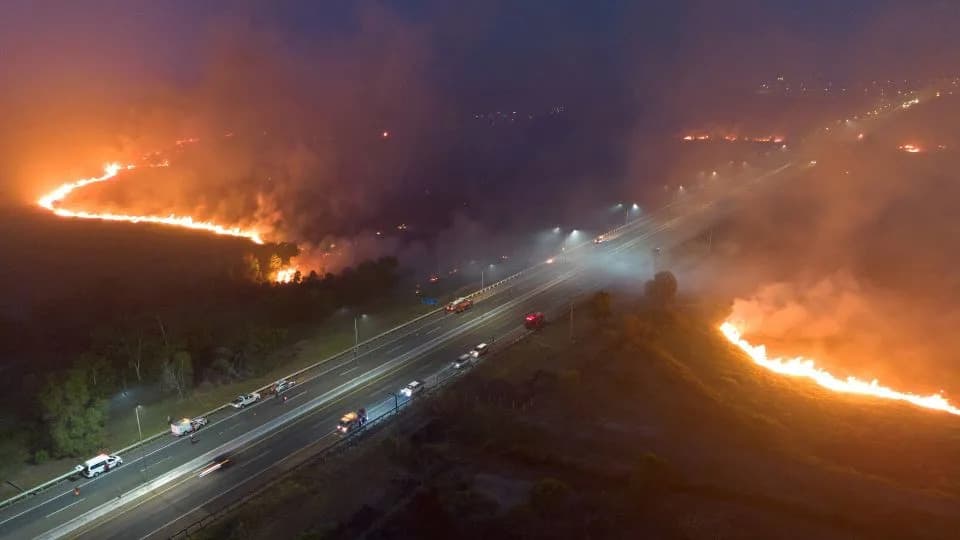
Across much of the globe, prolonged drought and extreme heat have driven a destructive wildfire season in 2026. This summer, France and Spain recorded their largest blazes since the European Union began keeping such records, forcing hundreds of thousands to evacuate areas around Bordeaux and Madrid. Fires also prompted evacuations in Greece and in remote regions of Canada, where dozens of concurrent blazes sent smoke as far south as Virginia. In the United States, the National Interagency Fire Center remains at its highest preparedness level as dozens of major fires burn across tens of thousands of acres in 14 states.
Wildfires close to population centers pose an immediate risk to life and property. The non-profit research group Climate Central reports that, in the U.S. since 1980, 24 wildfires each caused at least $1 billion in damage; together those events resulted in 568 deaths and nearly $220 billion in losses. Beyond the direct danger, wildfire smoke produces long-term environmental and public-health harms.
Through Aug. 1, 2026, wildfires worldwide have scorched roughly 433,500 square miles. Data from the Global Wildfire Information System (GWIS) indicate those fires released more than 2.3 billion metric tons of carbon dioxide — an amount nearly equal to the annual emissions of the entire European Union. Smoke also contains fine particulate matter (PM2.5), microscopic particles tied to heart attacks, respiratory distress and increased mortality.
Using GWIS figures, the monitoring project Climate Crisis 247 ranked countries by wildfire-related carbon emissions between Jan. 1 and Aug. 1, 2026. The rankings are based on recorded wildfire carbon emissions; supplemental PM2.5 estimates are also from GWIS. For context, researchers compared those wildfire carbon totals to annual state-level carbon footprints using U.S. Energy Information Administration data.
Top 10 Countries By Wildfire Carbon Emissions (Jan. 1–Aug. 1, 2026)
10. Indonesia
Carbon emissions: 59.9 million metric tons (≈ annual carbon footprint of Arkansas)
PM2.5 from wildfires: 322,191 metric tons
Land burned: 1,886 sq. miles (≈ Rhode Island)
9. Brazil
Carbon emissions: 70.2 million metric tons (≈ annual carbon footprint of South Carolina)
PM2.5 from wildfires: 298,159 metric tons
Land burned: 7,839 sq. miles (≈ New Jersey)
8. United States
Carbon emissions: 77.1 million metric tons (≈ annual carbon footprint of Minnesota)
PM2.5 from wildfires: 355,436 metric tons
Land burned: 9,155 sq. miles (≈ New Hampshire)
7. Central African Republic
Carbon emissions: 79.8 million metric tons (≈ annual carbon footprint of Colorado)
PM2.5 from wildfires: 246,112 metric tons
Land burned: 23,235 sq. miles (≈ West Virginia)
6. Australia
Carbon emissions: 108.5 million metric tons (≈ annual carbon footprint of Kentucky)
PM2.5 from wildfires: 365,551 metric tons
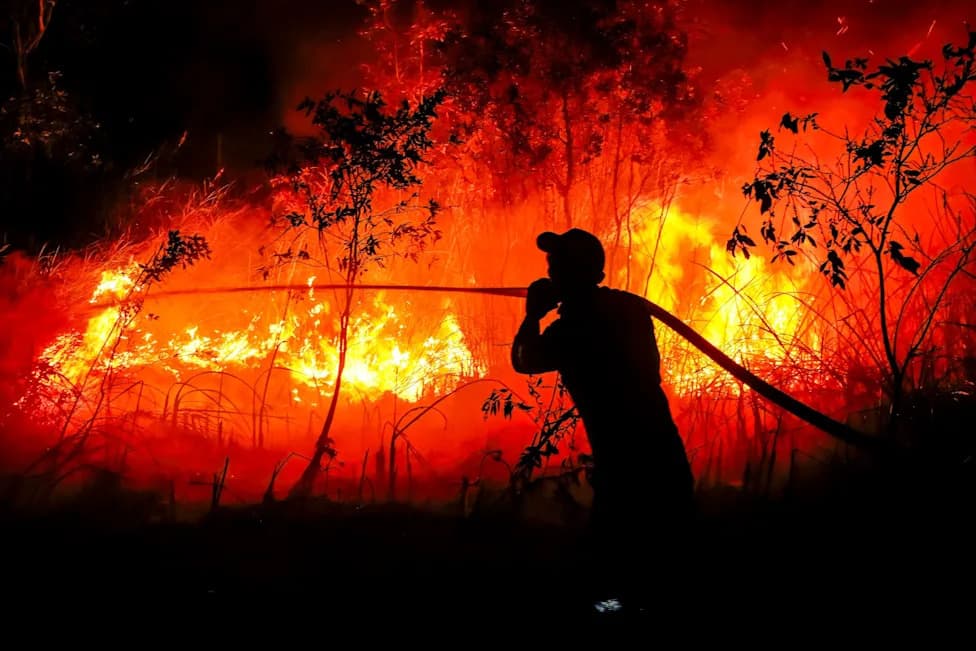
Photo bytomonUnsplash
Land burned: 45,566 sq. miles (≈ Ohio)
5. South Sudan
Carbon emissions: 124.3 million metric tons (≈ annual carbon footprint of North Carolina)
PM2.5 from wildfires: 373,973 metric tons
Land burned: 26,853 sq. miles (≈ West Virginia)
4. Angola
Carbon emissions: 132.1 million metric tons (≈ annual carbon footprint of Georgia)
PM2.5 from wildfires: 416,640 metric tons
Land burned: 28,854 sq. miles (≈ South Carolina)
3. Canada
Carbon emissions: 155.5 million metric tons (≈ annual carbon footprint of Indiana)
PM2.5 from wildfires: 1.3 million metric tons
Land burned: 7,845 sq. miles (≈ New Jersey)
2. Russia
Carbon emissions: 187.0 million metric tons (≈ annual carbon footprint of Louisiana)
PM2.5 from wildfires: 1.3 million metric tons
Land burned: 12,877 sq. miles (≈ Maryland)
1. Democratic Republic of Congo
Carbon emissions: 310.0 million metric tons (≈ annual carbon footprint of California)
PM2.5 from wildfires: 1.2 million metric tons
Land burned: 52,553 sq. miles (≈ Louisiana)
The data show how a single wildfire season can produce emissions comparable to the yearly output of entire countries or U.S. states, while releasing particulate pollution that crosses borders and threatens public health. Monitoring organizations and emergency agencies warn that ongoing drought and extreme heat will keep wildfire risks elevated in many regions.
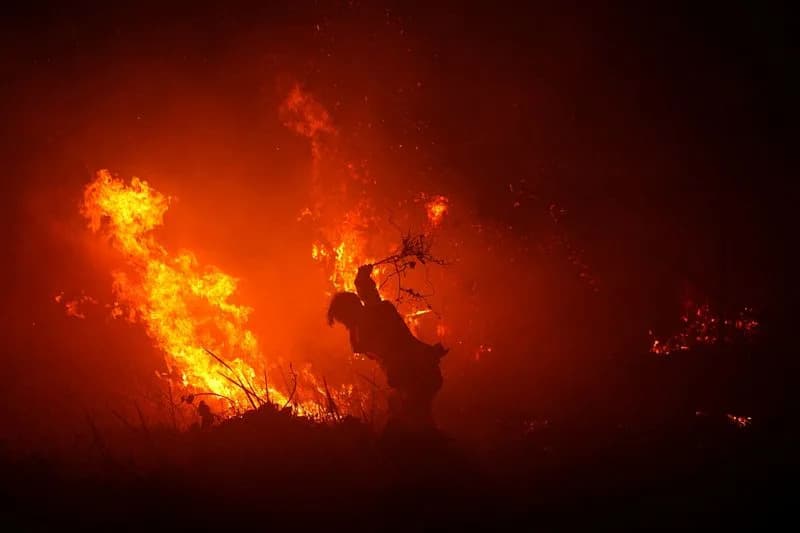
Photo credit: tomon / Unsplash
Help us improve.