California will make the California Science Test (CAST) a fully weighted accountability metric on the California School Dashboard starting with scores released this fall, fulfilling a decade-long push by NGSS advocates. CAST proficiency (32.7% in 2024–25) trails math and ELA and shows stark racial and socioeconomic gaps. The state has invested $50 million in professional learning and resources like Atlas to support NGSS implementation. Critics also warn a new dashboard growth display — which flags one-point scale-score gains — may overstate progress; revisions are planned for 2027.
California Adds Science To Its School Accountability Dashboard — A Decade-Long Win For NGSS
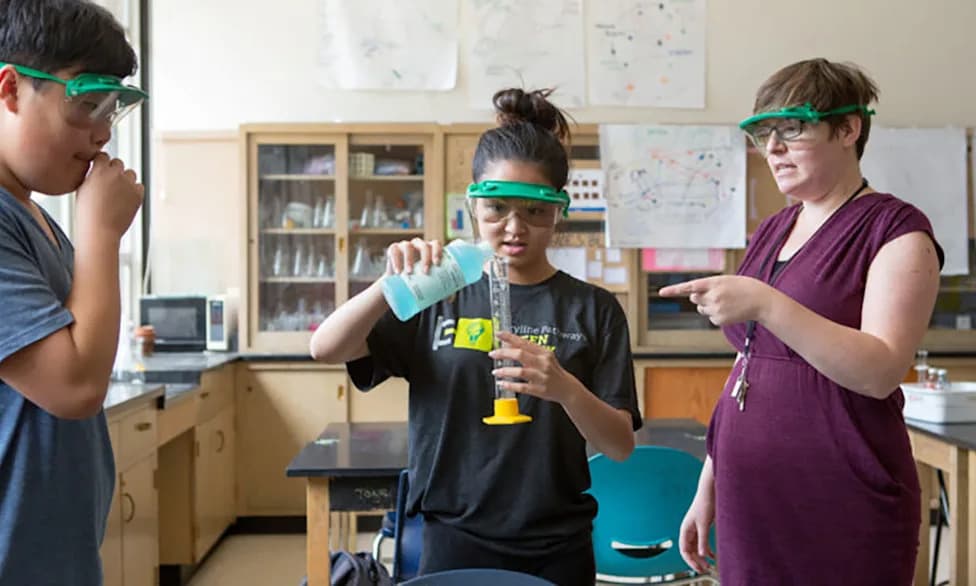
Two high school students conduct a science experiment as a teacher on the right guides them.
What would normally be a dry agenda item on the California School Dashboard unexpectedly moved some people to tears this month. The State Board of Education confirmed that science test results will become a fully weighted accountability metric on the state dashboard beginning with scores released this fall — a milestone science educators have pursued for roughly a decade.
Why This Matters
Making the California Science Test (CAST) a fully weighted indicator elevates science to the same status as English language arts, math, suspension rates and chronic absenteeism. Advocates say the change should prompt districts to invest more in NGSS-aligned instruction, professional development and curriculum — and help ensure science instruction is not treated as an afterthought.
History And Timeline
California adopted the Next Generation Science Standards (NGSS) in 2013. The California Science Test (CAST) was first administered in 2019 for fifth and eighth graders and once in high school. CAST results appeared on the dashboard for "informational purposes" while the state collected the three years of data needed for accountability. The State Board will decide in 2029 how to integrate science scores and a new student-growth measure into the revised Statewide System of Support.

Jessica Sawko's Next Generation Science Standards earrings. (Credit: Jessica Sawko)
How CAST Reflects NGSS
CAST is a two-hour, computer-based assessment with performance tasks that emphasize data analysis, modeling and scientific reasoning. Rather than recalling facts, students apply inquiry skills to real-world scenarios — for example, modeling moon phases or using data to explain weather phenomena. NGSS stresses hands-on practices and cross-cutting concepts that bridge disciplinary content.
Performance And Equity Gaps
CAST proficiency remains low and lags behind other subjects. In 2024–25, 32.7% of students were proficient in science, compared with 37.3% in math and 48.8% in English language arts. Proficiency disparities mirror gaps in other subjects: 18.6% proficiency for students whose parents completed high school versus 43.9% for students with college-educated parents; 51.3% for non–socioeconomically disadvantaged students versus 22.3% for disadvantaged students; and 60.8% proficiency for Asian students compared with 17.1% for Black students.
Investments And Supports
The state and partners have begun building supports to strengthen NGSS implementation. A $50 million state investment funded the California Mathematics, Science, and Computer Science Partnership to create county-level professional learning networks across all 58 counties. The Department of Education and the Los Angeles County Office of Education created Atlas, an online library of teacher-created performance tasks. Institutions such as the Exploratorium, the Lawrence Hall of Science and nonprofits like Ten Strands provide training and curriculum resources.
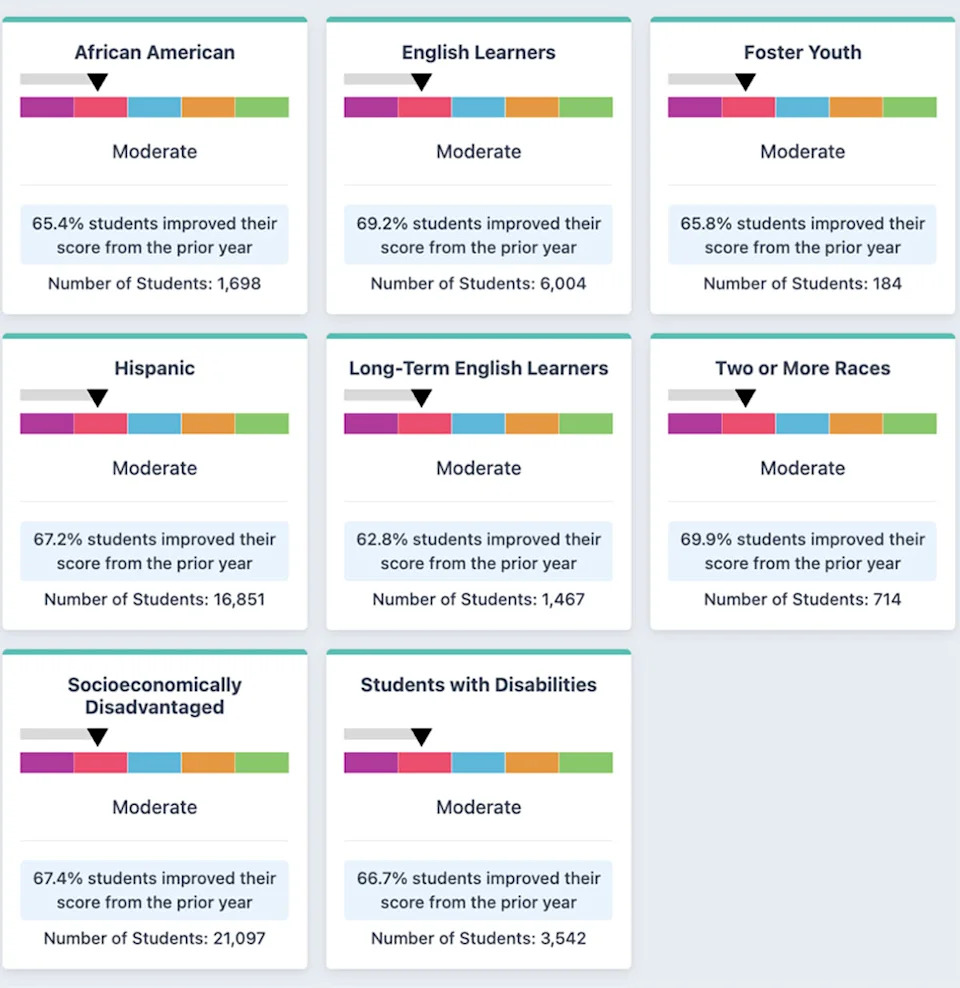
Here is how student groups in Fresno Unified whose English language arts scores increased by at least one scale point are presented on the 2024-25 California School Dashboard. Compared with other students statewide, these eight groups were rated "moderate," the second lowest of five levels. Four of the 12 subgroups in Fresno were rated blue or average, and one ranked purple, the lowest. The 2026 scores will be posted in the fall.(Source: California School Dashboard)
Controversy Over The Growth Metric
Alongside science, the State Board approved a student-growth indicator to appear on the dashboard this fall (not yet for accountability). California adopted a residual gain model to calculate growth, comparing individual students' gains to statewide averages. But the dashboard will initially display a simpler metric — the percentage of students whose scores rose by at least one scale point — which critics say overstates progress. Observers note a one-point gain can represent only a few days of learning and argue the presentation risks giving an overly optimistic picture of student progress.
"I'm sorry, I'm emotional. It's been like a decade," said Jessica Sawko of Children Now and the California STEM Network upon the board's decision — underscoring how long educators have advocated for this change.
What Comes Next
The Department of Education has acknowledged criticism of the growth display and the State Board asked the department to revise the Dashboard Growth Data Cards, with plans to include an average scale-score-above/below-predicted metric for the 2027 dashboard. Advocates are pressing districts to back professional learning and to sustain investments when the current $50 million grant expires in June 2027.
With science now elevated on the dashboard, the next challenge is ensuring districts convert visibility into sustained funding, classroom time, and quality instruction that narrows achievement gaps and strengthens student inquiry and reasoning.
Help us improve.