The HETDEX team has produced the largest and most precise 3D map of hydrogen’s Lyman‑alpha ultraviolet emission, covering light from about 9–11 billion years ago. Using Line Intensity Mapping on roughly 0.5 PB of data and more than 600 million spectra, researchers recovered faint emission that standard catalogs miss. The map reveals Lyman‑alpha glow around bright galaxies and across intergalactic regions and will serve as an empirical benchmark for galaxy‑formation simulations.
HETDEX Builds Largest, Most Precise 3D Map of the Early Universe’s Lyman‑Alpha Glow
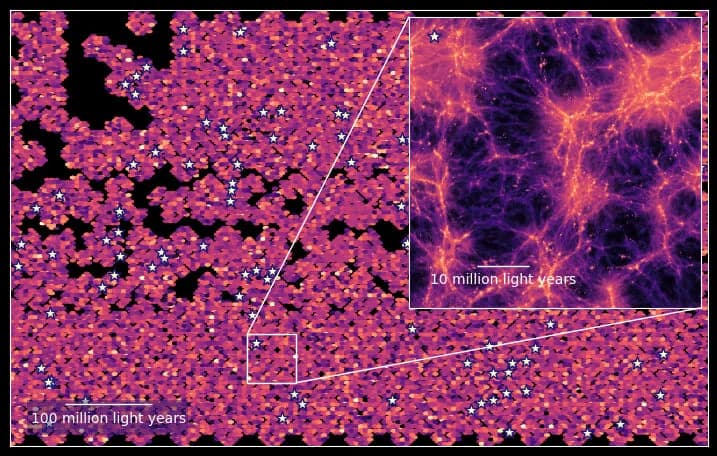
Section of the Line Intensity Map created by charting the distribution and concentration of excited hydrogen via the Lyman alpha wavelength in the universe 10 billion years ago. (CREDIT: Maja Lujan Niemeyer/Max Planck Institute for Astrophysics/HETDEX, Chris Byrohl/Stanford University/HETDEX)
The space between galaxies is far from empty. In a newly produced three‑dimensional map, seemingly blank regions of the early cosmos reveal a faint hydrogen-blue glow that previous surveys largely missed.
A team working with the Hobby‑Eberly Telescope Dark Energy Experiment (HETDEX) reports it has produced the largest and most precise 3D map yet of the hydrogen Lyman‑alpha ultraviolet signature. The map covers light emitted roughly 9 to 11 billion years ago — a critical epoch when star formation was especially active and hydrogen across vast volumes was illuminated.
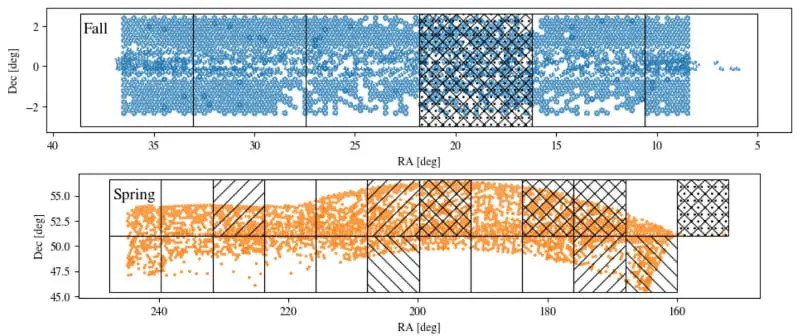
IFU coordinates in the Fall (top panel), Spring (middle panel), and NEP (bottom panel) fields. Masked maps are shown as hatched regions. The backward-facing (forward-facing) diagonal hatchings represent boxes masked in the low-z (medium-z) bin, and the dotted hatchings indicate those masked in the high-z bin. (CREDIT: The Astrophysical Journal)
How They Did It
Instead of cataloging only individually detected bright galaxies, the researchers used a technique called Line Intensity Mapping. This method measures the collective distribution of a chosen spectral line (in this case, Lyman‑alpha) across a wide region, allowing the combined emission from faint galaxies and diffuse intergalactic gas to be recovered even when individual sources are too weak to detect.
HETDEX collected more than 600 million spectra over a sky area larger than 2,000 full Moons. To build the new map the team processed roughly 0.5 petabytes of data with custom software on supercomputers at the Texas Advanced Computing Center. They then used the positions of bright galaxies already identified by HETDEX as signposts: because matter clusters under gravity, known bright galaxies often sit near fainter galaxies and diffuse gas, which helps assign distances to the faint emissions.
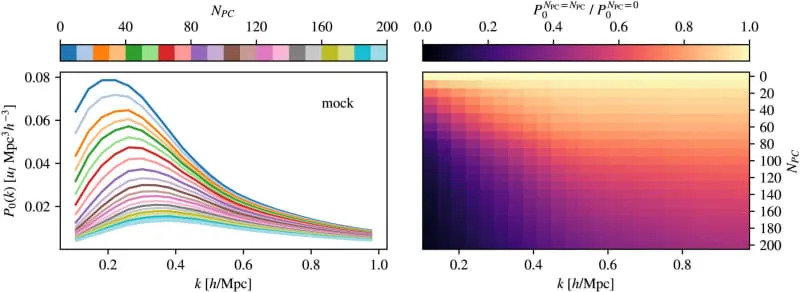
Left panel: suppression of the power spectrum monopole due to PCA cleaning. We show the mean power spectrum monopole obtained from the fiducial mocks in the Spring field in the medium-z bin. Right panel: the ratio of the power spectrum monopole with and without NPC PCs removed as a function of k and NPC. (CREDIT: The Astrophysical Journal)
What They Found
The result is not a conventional catalog of sources but a 3D picture showing where hydrogen’s Lyman‑alpha glow concentrates — both around bright, previously cataloged galaxies and across the less obvious stretches between them. The team says this is the first time intensity mapping has been applied to Lyman‑alpha with this degree of precision across such a large dataset.
“Observing the early universe gives us an idea of how galaxies evolved into their current form, and what role intergalactic gas played in this process,”
— Maja Lujan Niemeyer, HETDEX scientist and lead on the map’s development.
Other project scientists stressed the untapped potential in HETDEX data. “We only use a small fraction of all the data we collect — around 5%,” said Karl Gebhardt, HETDEX principal investigator. The intensity‑mapping approach converts that leftover data into meaningful information about faint galaxies and the cosmic web.
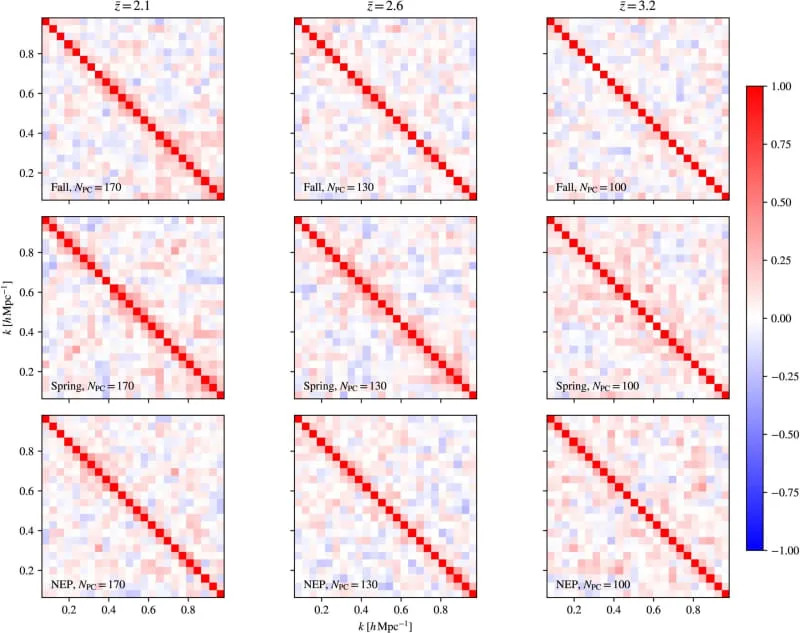
Correlation matrices of the power spectrum monopoles in the same order. (CREDIT: The Astrophysical Journal)
Why It Matters
This map provides an empirical benchmark to test and refine computer simulations of galaxy formation and the behavior of intergalactic gas at this epoch. The team plans to compare their Lyman‑alpha intensity map with maps of other emission lines — for example, carbon monoxide (CO), which traces cold, dense clouds where stars form — to build a more complete picture of the environments that hosted early star formation.
The results are published in The Astrophysical Journal. The map opens a new window onto the faint universe and demonstrates how advanced analysis of existing survey data can reveal previously hidden structure in the cosmic web.
Help us improve.