Pi appears both in straightforward geometry and in surprising probabilistic experiments. Random point sampling inside a unit circle in a square estimates π/4; Buffon’s needle yields a crossing probability of 2/π; and a coin‑flip rule (stop when heads lead by one) has expected head fraction π/4. These methods are instructive but inefficient for high‑precision π estimates, making them best suited for classroom demonstrations or recreational exploration.
Finding π in Randomness: 3 Hands‑On Ways to Estimate Pi (Yes, Even With Coins)
Amanda Montañez
Pi (π ≈ 3.14159) shows up not only in obvious geometry but also in surprising probabilistic experiments. Below are three hands‑on, chance‑based methods you can try at home or in class that converge (in expectation) to ratios involving π. Each method illustrates a different mathematical idea—area ratios, geometric probability, and unexpected connections between discrete random processes and trigonometric functions.
1. Monte Carlo Points: Area Ratios Give π/4
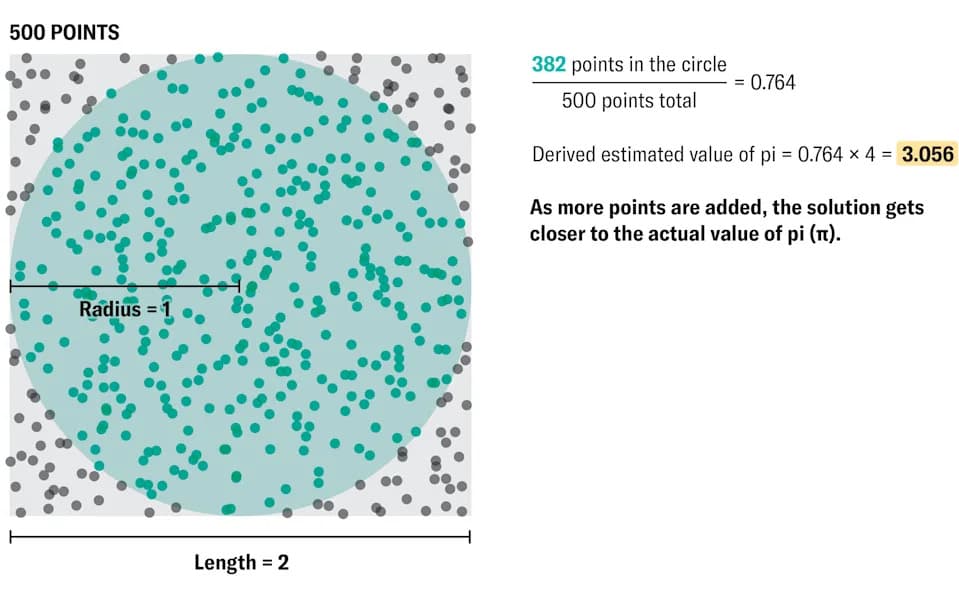
Take a square of side length 2 and inscribe a circle of radius 1 so it touches the square’s sides. Randomly generate or drop points uniformly inside the square. As the number of points grows, the fraction that land inside the circle approaches the ratio of the circle’s area to the square’s area, i.e., π/4. This is a classic Monte Carlo demonstration: random sampling approximates an exact geometric quantity (circle area = π·1²; square area = 4).
Amanda Montañez
2. Buffon’s Needle (and Noodle): Why 2/π Appears
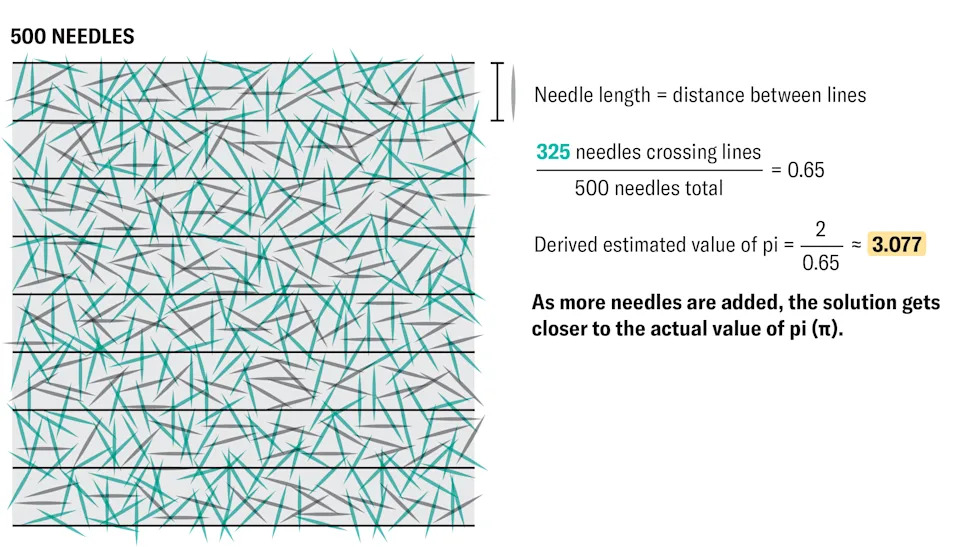
In 1733 Georges‑Louis Leclerc, Comte de Buffon posed this problem: drop a needle on a floor with parallel lines spaced one needle‑length apart; what fraction of drops cross a line? The answer is 2/π (≈ 0.6366). The result generalizes to the “Buffon’s noodle” version: for any curve of a given length, the expected number of line crossings is proportional to that length. A neat special case is a circular loop of diameter 1—it always crosses the lines twice, and its circumference is π, which leads to the 2/π probability for a unit‑length object.
3. A Coin‑Flip Estimator: Stop When Heads Lead by One (Expected Heads Fraction = π/4)
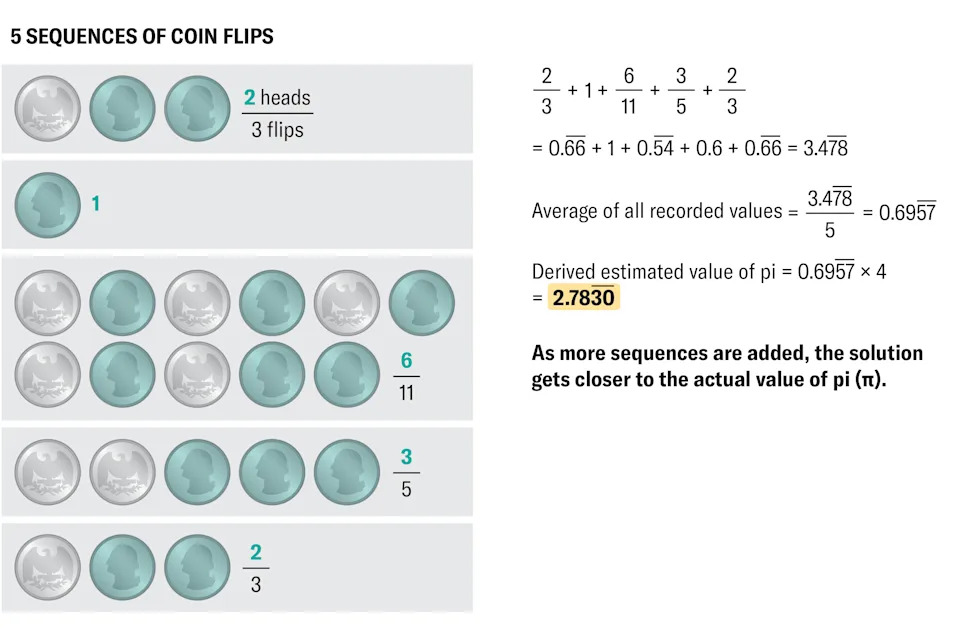
Flip a fair coin repeatedly until the number of heads exceeds tails by one. Record the proportion of flips that were heads in that sequence. For example, if the first flip is heads you stop immediately and record 1; if the sequence is T, H, T, H, H you stop and record 3/5. The surprising fact—highlighted recently by James Propp (UMass Lowell)—is that the expected value of that proportion equals π/4. The analytic explanation uses an infinite sum related to the arcsin function; an intuitive, direct link between flipping coins and π remains elusive to mathematicians, which is part of what makes the result delightful.
Amanda Montañez
Related Work: Vienna University of Technology mathematician Stefan Gerhold and co‑authors reported a closely related phenomenon (involving families stopping when boys exceed girls by one) in a 2025 preprint, again producing expectations involving π.
Practical Notes: Inefficiency and Classroom Use
None of these chance‑based procedures are efficient ways to compute many digits of π. The coin‑flip method in particular is extremely slow in practice: Propp estimates reaching π ≈ 3.14 might require on the order of 10^12 flips, because some sequences can be arbitrarily long (the expected sequence length is infinite). The Monte Carlo point method and Buffon’s needle method can also require roughly a million trials to settle near 3.14 with typical random variation, though luck sometimes helps. Because coin‑flip sequences must be observed in order, they are less parallelizable—Propp suggests running many short sequences simultaneously (for example, across a classroom) rather than one enormous sequence.
These experiments are pedagogically rich: they connect geometry, probability, and analysis, and they make abstract constants like π feel tangible. If you try them, record many trials and plot how your estimates change as sample size grows—it's a great way to see randomness converge toward a mathematical constant.
Help us improve.